Xcel Energy 2008 Annual Report Download - page 92
Download and view the complete annual report
Please find page 92 of the 2008 Xcel Energy annual report below. You can navigate through the pages in the report by either clicking on the pages listed below, or by using the keyword search tool below to find specific information within the annual report.-
 1
1 -
2
-
3
-
4
-
5
-
6
-
7
-
8
-
9
-
10
-
11
-
12
-
13
-
14
-
15
-
16
-
17
-
18
-
19
-
20
-
21
-
22
-
23
-
24
-
25
-
26
-
27
-
28
-
29
-
30
-
31
-
32
-
33
-
34
-
35
-
36
-
37
-
38
-
39
-
40
-
41
-
42
-
43
-
44
-
45
-
46
-
47
-
48
-
49
-
50
-
51
-
52
-
53
-
54
-
55
-
56
-
57
-
58
-
59
-
60
-
61
-
62
-
63
-
64
-
65
-
66
-
67
-
68
-
69
-
70
-
71
-
72
-
73
-
74
-
75
-
76
-
77
-
78
-
79
-
80
-
81
-
 82
82 -
 83
83 -
 84
84 -
 85
85 -
 86
86 -
 87
87 -
 88
88 -
 89
89 -
 90
90 -
 91
91 -
 92
92 -
 93
93 -
 94
94 -
 95
95 -
 96
96 -
 97
97 -
 98
98 -
 99
99 -
 100
100 -
 101
101 -
 102
102 -
103
-
104
-
105
-
106
-
107
-
108
-
109
-
110
-
111
-
112
-
113
-
114
-
115
-
116
-
117
-
118
-
119
-
120
-
121
-
122
-
123
-
124
-
125
-
126
-
127
-
128
-
129
-
130
-
131
-
132
-
133
-
134
-
135
-
136
-
137
-
138
-
139
-
140
-
141
-
142
-
143
-
144
-
145
-
146
-
147
-
148
-
149
-
150
-
151
-
152
-
153
-
154
-
155
-
156
-
157
-
158
-
159
-
160
-
161
-
162
-
163
-
164
-
165
-
166
-
167
-
168
-
169
-
170
-
171
-
172
 |
 |

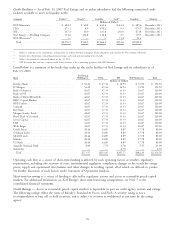
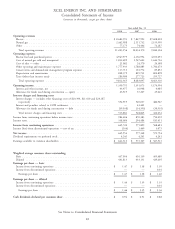
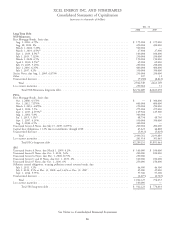
XCEL ENERGY INC. AND SUBSIDIARIES
Consolidated Statements of Income
(amounts in thousands, except per share data)
Year ended Dec. 31
2008 2007 2006
Operating revenues
Electric ................................................... $8,682,993 $ 7,847,992 $7,608,018
Natural gas ................................................ 2,442,988 2,111,732 2,155,999
Other ................................................... 77,175 74,446 76,287
Total operating revenues ...................................... 11,203,156 10,034,170 9,840,304
Operating expenses
Electric fuel and purchased power .................................. 4,947,979 4,136,994 4,103,055
Cost of natural gas sold and transported .............................. 1,832,699 1,547,622 1,644,716
Cost of sales — other ......................................... 21,082 24,370 24,388
Other operating and maintenance expenses ............................ 1,777,933 1,788,885 1,706,673
Conservation and demand-side management program expenses ................ 117,713 101,772 85,853
Depreciation and amortization .................................... 828,379 805,731 802,898
Taxes (other than income taxes) ................................... 286,580 277,723 295,727
Total operating expenses ...................................... 9,812,365 8,683,097 8,663,310
Operating income ............................................. 1,390,791 1,351,073 1,176,994
Interest and other income, net .................................... 43,977 10,948 4,085
Allowance for funds used during construction — equity .................... 63,519 37,207 25,045
Interest charges and financing costs
Interest charges — includes other financing costs of $20,390, $21,410 and $24,187,
respectively ............................................... 552,919 520,037 486,967
Interest and penalties related to COLI settlement ......................... — 43,401 —
Allowance for funds used during construction — debt ..................... (39,038) (34,593) (30,935)
Total interest charges and financing costs ............................ 513,881 528,845 456,032
Income from continuing operations before income taxes ...................... 984,406 870,383 750,092
Income taxes ................................................. 338,686 294,484 181,411
Income from continuing operations ................................. 645,720 575,899 568,681
Income (loss) from discontinued operations — net of tax ..................... (166) 1,449 3,073
Net income ................................................. 645,554 577,348 571,754
Dividend requirements on preferred stock ............................... 4,241 4,241 4,241
Earnings available to common shareholders .............................. $ 641,313 $ 573,107 $ 567,513
Weighted average common shares outstanding
Basic .................................................... 437,054 416,139 405,689
Diluted .................................................. 441,813 433,131 429,605
Earnings per share — basic
Income from continuing operations ................................. $ 1.47 $ 1.38 $ 1.39
Income from discontinued operations ................................ — — 0.01
Earnings per share .......................................... $ 1.47 $ 1.38 $ 1.40
Earnings per share — diluted
Income from continuing operations ................................. $ 1.46 $ 1.35 $ 1.35
Income from discontinued operations ................................ — — 0.01
Earnings per share .......................................... $ 1.46 $ 1.35 $ 1.36
Cash dividends declared per common share ............................ $ 0.94 $ 0.91 $ 0.88
See Notes to Consolidated Financial Statements
82