Xcel Energy 2008 Annual Report Download - page 81
Download and view the complete annual report
Please find page 81 of the 2008 Xcel Energy annual report below. You can navigate through the pages in the report by either clicking on the pages listed below, or by using the keyword search tool below to find specific information within the annual report.-
 1
1 -
2
-
3
-
4
-
5
-
6
-
7
-
8
-
9
-
10
-
11
-
12
-
13
-
14
-
15
-
16
-
17
-
18
-
19
-
20
-
21
-
22
-
23
-
24
-
25
-
26
-
27
-
28
-
29
-
30
-
31
-
32
-
33
-
34
-
35
-
36
-
37
-
38
-
39
-
40
-
41
-
42
-
43
-
44
-
45
-
46
-
47
-
48
-
49
-
50
-
51
-
52
-
53
-
54
-
55
-
56
-
57
-
58
-
59
-
60
-
61
-
62
-
63
-
64
-
65
-
66
-
67
-
68
-
69
-
70
-
 71
71 -
 72
72 -
 73
73 -
 74
74 -
 75
75 -
 76
76 -
 77
77 -
 78
78 -
 79
79 -
 80
80 -
 81
81 -
 82
82 -
 83
83 -
 84
84 -
 85
85 -
 86
86 -
 87
87 -
 88
88 -
 89
89 -
 90
90 -
 91
91 -
92
-
93
-
94
-
95
-
96
-
97
-
98
-
99
-
100
-
101
-
102
-
103
-
104
-
105
-
106
-
107
-
108
-
109
-
110
-
111
-
112
-
113
-
114
-
115
-
116
-
117
-
118
-
119
-
120
-
121
-
122
-
123
-
124
-
125
-
126
-
127
-
128
-
129
-
130
-
131
-
132
-
133
-
134
-
135
-
136
-
137
-
138
-
139
-
140
-
141
-
142
-
143
-
144
-
145
-
146
-
147
-
148
-
149
-
150
-
151
-
152
-
153
-
154
-
155
-
156
-
157
-
158
-
159
-
160
-
161
-
162
-
163
-
164
-
165
-
166
-
167
-
168
-
169
-
170
-
171
-
172
 |
 |

Xcel Energy also assesses the impact of its own credit risk when determining the fair value of commodity derivative
liabilities. The impact of discounting commodity derivative liabilities for credit risk was immaterial to the fair value of
commodity derivative liabilities at Dec. 31, 2008.
Commodity derivatives assets and liabilities assigned to Level 3 consist primarily of FTRs, as well as forwards and
options that are either long-term in nature or related to commodities and delivery points with limited observability.
Level 3 commodity derivative assets and liabilities represent approximately 3 percent and 26 percent of total assets and
liabilities measured at fair value, respectively, at Dec. 31, 2008.
Determining the fair value of a FTR requires numerous management forecasts that vary in observability, including
various forward commodity prices, retail and wholesale demand, generation, and resulting transmission system
congestion. Given the limited observability of management’s forecasts for several of these inputs, these instruments have
been assigned a Level 3. Level 3 commodity derivatives assets and liabilities include $36.9 million and $13.4 million of
estimated fair values, respectively, for FTRs held at Dec. 31, 2008.
Determining the fair value of certain commodity forwards and options can require management to make use of
subjective forward price and volatility forecasts for commodities and locations with limited observability, or subjective
forecasts which extend to periods beyond those readily observable on active exchanges or quoted by brokers. When less
observable forward price and volatility forecasts are significant to determining the value of commodity forwards and
options, these instruments are assigned to Level 3. Level 3 commodity derivatives assets and liabilities include
$2.7 million and $2.9 million of estimated fair values, respectively, for commodity forwards and options held at
Dec. 31, 2008.
Nuclear Decommissioning Fund — Nuclear decommissioning fund assets assigned to Level 3 consist of asset-backed and
mortgage-backed securities. To the extent appropriate, observable market inputs are utilized to estimate the fair value of
these securities, however, less observable and subjective risk-based adjustments to estimated yield and forecasted
prepayments are often significant to these valuations. Therefore, estimated fair values for all asset-backed and mortgage-
backed securities totaling $109.4 million in the nuclear decommissioning fund at Dec. 31, 2008 (approximately
9 percent of total assets measured at fair value), are assigned to Level 3. Realized and unrealized gains and losses on
nuclear decommissioning fund investments are deferred as a component of a nuclear decommissioning regulatory asset.
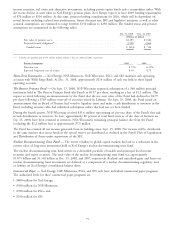
Liquidity and Capital Resources
Cash Flows
2008 2007(a) 2006
(Millions of Dollars)
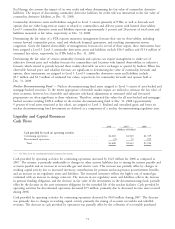
Cash provided by (used in) operating activities
Continuing operations .............................. $1,683 $1,560 $1,729
Discontinued operations ............................. (3) 72 195
Total ....................................... $1,680 $1,632 $1,924
(a) — See Note 22 to the consolidated financial statements for revision.
Cash provided by operating activities for continuing operations increased by $123 million for 2008 as compared to
2007. The increase is primarily attributable to changes in other current liabilities due to timing for interest payable and
accounts payable and an increase in recoverable gas and electric costs. This increase was partially offset by changes in
working capital activity due to increased inventory, contributions for pension and non-pension postretirement benefits,
and an increase in net regulatory assets and liabilities. The increased inventory reflects the higher cost of natural gas
combined with an increase in storage contracts. The increase in net regulatory assets and liabilities reflects the increase
in pension funding obligation, and the decrease in fair value of the investments in the decommissioning fund, partially
offset by the decrease in the asset retirement obligation for the extended life of the nuclear facilities. Cash provided by
operating activities for discontinued operations decreased $75 million, primarily due to decreased income taxes received
during 2008.
Cash provided by operating activities for continuing operations decreased by $169 million during 2007. The decrease
was primarily due to changes in working capital activity primarily the timing of accounts receivables and unbilled
revenues. The decrease in cash provided by operations was partially offset by the collection of recoverable purchased
71