Xcel Energy 2008 Annual Report Download - page 88
Download and view the complete annual report
Please find page 88 of the 2008 Xcel Energy annual report below. You can navigate through the pages in the report by either clicking on the pages listed below, or by using the keyword search tool below to find specific information within the annual report.-
 1
1 -
2
-
3
-
4
-
5
-
6
-
7
-
8
-
9
-
10
-
11
-
12
-
13
-
14
-
15
-
16
-
17
-
18
-
19
-
20
-
21
-
22
-
23
-
24
-
25
-
26
-
27
-
28
-
29
-
30
-
31
-
32
-
33
-
34
-
35
-
36
-
37
-
38
-
39
-
40
-
41
-
42
-
43
-
44
-
45
-
46
-
47
-
48
-
49
-
50
-
51
-
52
-
53
-
54
-
55
-
56
-
57
-
58
-
59
-
60
-
61
-
62
-
63
-
64
-
65
-
66
-
67
-
68
-
69
-
70
-
71
-
72
-
73
-
74
-
75
-
76
-
77
-
 78
78 -
 79
79 -
 80
80 -
 81
81 -
 82
82 -
 83
83 -
 84
84 -
 85
85 -
 86
86 -
 87
87 -
 88
88 -
 89
89 -
 90
90 -
 91
91 -
 92
92 -
 93
93 -
 94
94 -
 95
95 -
 96
96 -
 97
97 -
 98
98 -
99
-
100
-
101
-
102
-
103
-
104
-
105
-
106
-
107
-
108
-
109
-
110
-
111
-
112
-
113
-
114
-
115
-
116
-
117
-
118
-
119
-
120
-
121
-
122
-
123
-
124
-
125
-
126
-
127
-
128
-
129
-
130
-
131
-
132
-
133
-
134
-
135
-
136
-
137
-
138
-
139
-
140
-
141
-
142
-
143
-
144
-
145
-
146
-
147
-
148
-
149
-
150
-
151
-
152
-
153
-
154
-
155
-
156
-
157
-
158
-
159
-
160
-
161
-
162
-
163
-
164
-
165
-
166
-
167
-
168
-
169
-
170
-
171
-
172
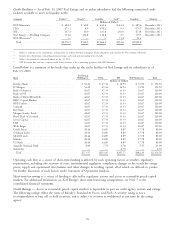
 |
 |
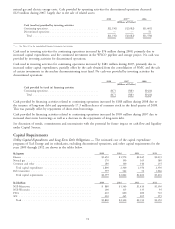
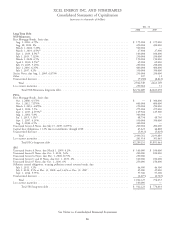
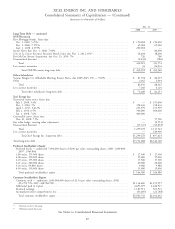
Long-Term Borrowings — See a discussion of the long-term borrowings in Note 6 to the consolidated financial
statements.
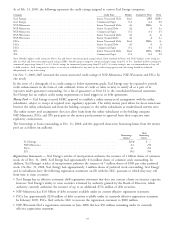
Future Financing Plans
Xcel Energy generally expects to fund its operations and capital investments through internally generated funds and by
periodically issuing short-term debt, long-term debt, common stock, preferred stock and hybrid securities.
Current debt financing plans for 2009 include the following:
• Approximately $400 million of first mortgage bonds at NSP-Minnesota.
• Approximately $400 million of first mortgage bonds at PSCo.
These financing plans are subject to change, depending on capital expenditures, internal cash generation, market
conditions and other factors.
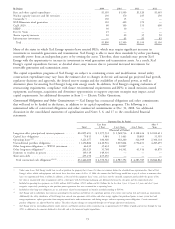
Off-Balance-Sheet Arrangements
Xcel Energy does not have any off-balance-sheet arrangements, other than those currently disclosed, that have or are
reasonably likely to have a current or future effect on financial condition, changes in financial condition, revenues or
expenses, results of operations, liquidity, capital expenditures or capital resources that is material to investors.
Earnings Guidance
Xcel Energy’s 2009 earnings guidance is $1.45 to $1.55 per share. Key assumptions are detailed below:
• Normal weather patterns are experienced for the year.
• Reasonable regulatory outcomes in the Minnesota electric rate case, the Colorado electric rate case, the Texas electric
rate case, the New Mexico electric rate case, the SPS FERC wholesale electric rate cases and other rate cases that may
be filed during the year.
• Various riders, associated with MERP, Minnesota and Colorado transmission and Minnesota renewable energy, are
expected to increase revenue by approximately $50 million to $60 million over 2008 levels.
• Weather adjusted electric residential sales growth of 0.0 percent to 0.5 percent.
• Weather adjusted retail firm natural gas sales decline by approximately (1.0) percent to 0.0 percent.
• Capacity costs are projected to increase approximately $45 million over 2008 levels. Capacity costs at PSCo are
recovered under the purchased capacity cost adjustment.
• Operating and maintenance expenses are projected to increase:
• Nuclear (including outage amortization) — $55 million
• Pension and medical — $25 million
• Other (including incentive compensation) — $75 million — $125 million
• Depreciation and amortization expense is projected to increase approximately $80 million to $90 million over 2008.
• Interest expense increases approximately $20 million to $30 million over 2008 levels.
• Allowance for funds used during construction-equity decreases approximately $5 million to $10 million over 2008.
• An effective tax rate for continuing operations of approximately 33 percent to 35 percent.
• Average common stock and equivalents of approximately 457 million shares.
Item 7A — Quantitative and Qualitative Disclosures About Market Risk
See Management’s Discussion and Analysis under Item 7, incorporated by reference.
78