Xcel Energy 2008 Annual Report Download - page 56
Download and view the complete annual report
Please find page 56 of the 2008 Xcel Energy annual report below. You can navigate through the pages in the report by either clicking on the pages listed below, or by using the keyword search tool below to find specific information within the annual report.-
 1
1 -
2
-
3
-
4
-
5
-
6
-
7
-
8
-
9
-
10
-
11
-
12
-
13
-
14
-
15
-
16
-
17
-
18
-
19
-
20
-
21
-
22
-
23
-
24
-
25
-
26
-
27
-
28
-
29
-
30
-
31
-
32
-
33
-
34
-
35
-
36
-
37
-
38
-
39
-
40
-
41
-
42
-
43
-
44
-
45
-
 46
46 -
 47
47 -
 48
48 -
 49
49 -
 50
50 -
 51
51 -
 52
52 -
 53
53 -
 54
54 -
 55
55 -
 56
56 -
 57
57 -
 58
58 -
 59
59 -
 60
60 -
 61
61 -
 62
62 -
 63
63 -
 64
64 -
 65
65 -
 66
66 -
67
-
68
-
69
-
70
-
71
-
72
-
73
-
74
-
75
-
76
-
77
-
78
-
79
-
80
-
81
-
82
-
83
-
84
-
85
-
86
-
87
-
88
-
89
-
90
-
91
-
92
-
93
-
94
-
95
-
96
-
97
-
98
-
99
-
100
-
101
-
102
-
103
-
104
-
105
-
106
-
107
-
108
-
109
-
110
-
111
-
112
-
113
-
114
-
115
-
116
-
117
-
118
-
119
-
120
-
121
-
122
-
123
-
124
-
125
-
126
-
127
-
128
-
129
-
130
-
131
-
132
-
133
-
134
-
135
-
136
-
137
-
138
-
139
-
140
-
141
-
142
-
143
-
144
-
145
-
146
-
147
-
148
-
149
-
150
-
151
-
152
-
153
-
154
-
155
-
156
-
157
-
158
-
159
-
160
-
161
-
162
-
163
-
164
-
165
-
166
-
167
-
168
-
169
-
170
-
171
-
172
 |
 |

26FEB200921425414
PART II
Item 5 — Market for Registrant’s Common Equity, Related Stockholder Matters and
Issuer Purchases of Equity Securities
Quarterly Stock Data
Xcel Energy’s common stock is listed on the New York Stock Exchange (NYSE). The trading symbol is XEL. The
following are the reported high and low sales prices based on the NYSE Composite Transactions for the quarters of
2008 and 2007 and the dividends declared per share during those quarters.
High Low Dividends
2008
First quarter ................................ $22.90 $19.39 $0.2300
Second quarter ............................... 21.73 19.67 0.2375
Third quarter ................................ 22.39 19.40 0.2375
Fourth quarter ............................... 20.21 15.32 0.2375
2007
First quarter ................................ $24.94 $22.75 $0.2225
Second quarter ............................... 25.03 19.97 0.2300
Third quarter ................................ 22.41 19.59 0.2300
Fourth quarter ............................... 23.50 20.70 0.2300
Book value per share at Dec. 31, 2008, was $15.35. The number of common shareholders of record as of Dec. 31,
2008 was approximately 87,000. Xcel Energy’s Restated Articles of Incorporation provide for certain restrictions on the
payment of cash dividends on common stock.
At Dec. 31, 2008 and 2007, the payment of cash dividends on common stock was not restricted. For further discussion
of Xcel Energy’s dividend policy, see Item 7 — Management’s Discussion and Analysis, Liquidity and Capital Resources.
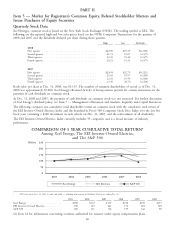
The following compares our cumulative total shareholder return on common stock with the cumulative total return of
the EEI Investor-Owned Electrics Index and the Standard & Poor’s 500 Composite Stock Price Index over the last five
fiscal years (assuming a $100 investment in each vehicle on Dec. 31, 2003, and the reinvestment of all dividends).
The EEI Investor-Owned Electrics Index currently includes 59 companies and is a broad measure of industry
performance.
COMPARISON OF 5 YEAR CUMULATIVE TOTAL RETURN*
Among Xcel Energy, The EEI Investor-Owned Electrics,
and The S&P 500
0
50
100
150
200
250
2003 2004 2005 2006 2007 2008
Dollars
Xcel Energy EEI Electrics S&P 500
* $100 invested on Dec. 31, 2003 in stock and index — including reinvestment of dividends. Fiscal years ending Dec. 31.
2003 2004 2005 2006 2007 2008
Xcel Energy ..................... $100 $112 $119 $156 $159 $137
EEI Investor-Owned Electrics .......... 100 123 143 172 201 149
S&P 500 ...................... 100 111 116 135 142 90
See Item 12 for information concerning securities authorized for issuance under equity compensation plans.
46