Xcel Energy 2008 Annual Report Download - page 126
Download and view the complete annual report
Please find page 126 of the 2008 Xcel Energy annual report below. You can navigate through the pages in the report by either clicking on the pages listed below, or by using the keyword search tool below to find specific information within the annual report.-
 1
1 -
2
-
3
-
4
-
5
-
6
-
7
-
8
-
9
-
10
-
11
-
12
-
13
-
14
-
15
-
16
-
17
-
18
-
19
-
20
-
21
-
22
-
23
-
24
-
25
-
26
-
27
-
28
-
29
-
30
-
31
-
32
-
33
-
34
-
35
-
36
-
37
-
38
-
39
-
40
-
41
-
42
-
43
-
44
-
45
-
46
-
47
-
48
-
49
-
50
-
51
-
52
-
53
-
54
-
55
-
56
-
57
-
58
-
59
-
60
-
61
-
62
-
63
-
64
-
65
-
66
-
67
-
68
-
69
-
70
-
71
-
72
-
73
-
74
-
75
-
76
-
77
-
78
-
79
-
80
-
81
-
82
-
83
-
84
-
85
-
86
-
87
-
88
-
89
-
90
-
91
-
92
-
93
-
94
-
95
-
96
-
97
-
98
-
99
-
100
-
101
-
102
-
103
-
104
-
105
-
106
-
107
-
108
-
109
-
110
-
111
-
112
-
113
-
114
-
115
-
 116
116 -
 117
117 -
 118
118 -
 119
119 -
 120
120 -
 121
121 -
 122
122 -
 123
123 -
 124
124 -
 125
125 -
 126
126 -
 127
127 -
 128
128 -
 129
129 -
 130
130 -
 131
131 -
 132
132 -
 133
133 -
 134
134 -
 135
135 -
 136
136 -
137
-
138
-
139
-
140
-
141
-
142
-
143
-
144
-
145
-
146
-
147
-
148
-
149
-
150
-
151
-
152
-
153
-
154
-
155
-
156
-
157
-
158
-
159
-
160
-
161
-
162
-
163
-
164
-
165
-
166
-
167
-
168
-
169
-
170
-
171
-
172
 |
 |

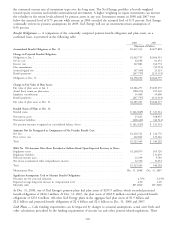
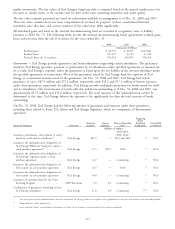
The following table shows the major components of the derivative instruments valuation in the consolidated balance
sheets at Dec. 31:
2008 2007
Derivative Derivative Derivative Derivative
Instruments Instruments Instruments Instruments
Valuation — Valuation — Valuation — Valuation —
Assets Liabilities Assets Liabilities
(Thousands of Dollars)
Long-term purchased power agreements ............... $374,692 $353,531 $426,774 $401,313
Electric and natural gas trading and hedging instruments .... 52,968 54,307 51,106 21,694
Interest rate hedging instruments ................... — 8,503 535 20,223
Total ................................... $427,660 $416,341 $478,415 $443,230
In 2003, as a result of FASB Statement 133 Implementation Issue No. C20, Xcel Energy began recording several
long-term purchased power agreements at fair value due to accounting requirements related to underlying price
adjustments. As these purchases are recovered through normal regulatory recovery mechanisms in the respective
jurisdictions, the changes in fair value for these contracts were offset by regulatory assets and liabilities. During the first
quarter of 2006, Xcel Energy qualified these contracts under the normal purchase exception. Based on this qualification,
the contracts are no longer adjusted to fair value and the previous carrying value of these contracts will be amortized
over the remaining contract lives along with the offsetting regulatory assets and liabilities.
Financial Impact of Qualifying Cash Flow Hedges — The impact of qualifying cash flow hedges on Xcel Energy’s
accumulated other comprehensive income, included in the consolidated statements of common stockholder’s equity and
comprehensive income, is detailed in the following table:
(Millions of Dollars)
Accumulated other comprehensive loss related to hedges at Dec. 31, 2005 ................ $ (8.8)
After-tax net unrealized gains related to derivatives accounted for as hedges ............... 11.8
After-tax net realized gains on derivative transactions reclassified into earnings .............. (0.8)
Accumulated other comprehensive income related to hedges at Dec. 31, 2006 .............. $ 2.2
After-tax net unrealized losses related to derivatives accounted for as hedges ............... (2.6)
After-tax net realized gains on derivative transactions reclassified into earnings .............. (1.0)
Accumulated other comprehensive loss related to hedges at Dec. 31, 2007 ................ $ (1.4)
After-tax net unrealized losses related to derivatives accounted for as hedges ............... (12.1)
After-tax net realized losses on derivative transactions reclassified into earnings ............. 0.4
Accumulated other comprehensive loss related to hedges at Dec. 31, 2008 ................ $(13.1)
Fair Value Hedges
Interest Rate Fair Value Hedges — Xcel Energy enters into interest rate swap instruments that effectively hedge the fair
value of fixed-rate debt. Xcel Energy holds no such instruments at Dec. 31, 2008. The fair market value of Xcel
Energy’s interest rate fair value hedges at Dec. 31, 2007, was a liability of approximately $2.6 million.
14. Financial Instruments
The estimated Dec. 31 fair values of Xcel Energy’s recorded financial instruments are as follows:
2008 2007
Carrying Carrying
Amount Fair Value Amount Fair Value
(Thousands of Dollars)
Nuclear decommissioning fund .......................... $1,075,294 $1,075,294 $1,317,564 $1,317,564
Other investments .................................. 9,864 9,864 40,019 40,019
Long-term debt, including current portion ................... 8,290,460 8,562,277 6,979,695 7,269,035
The fair value of cash and cash equivalents, notes and accounts receivable and notes and accounts payable are not
materially different from their carrying amounts. The fair value of Xcel Energy’s nuclear decommissioning fund is based
on published trading data and pricing models, generally using the most observable inputs available for each class of
security. The fair values of Xcel Energy’s other investments are estimated based on quoted market prices for those or
116