Xcel Energy 2008 Annual Report Download - page 157
Download and view the complete annual report
Please find page 157 of the 2008 Xcel Energy annual report below. You can navigate through the pages in the report by either clicking on the pages listed below, or by using the keyword search tool below to find specific information within the annual report.-
 1
1 -
2
-
3
-
4
-
5
-
6
-
7
-
8
-
9
-
10
-
11
-
12
-
13
-
14
-
15
-
16
-
17
-
18
-
19
-
20
-
21
-
22
-
23
-
24
-
25
-
26
-
27
-
28
-
29
-
30
-
31
-
32
-
33
-
34
-
35
-
36
-
37
-
38
-
39
-
40
-
41
-
42
-
43
-
44
-
45
-
46
-
47
-
48
-
49
-
50
-
51
-
52
-
53
-
54
-
55
-
56
-
57
-
58
-
59
-
60
-
61
-
62
-
63
-
64
-
65
-
66
-
67
-
68
-
69
-
70
-
71
-
72
-
73
-
74
-
75
-
76
-
77
-
78
-
79
-
80
-
81
-
82
-
83
-
84
-
85
-
86
-
87
-
88
-
89
-
90
-
91
-
92
-
93
-
94
-
95
-
96
-
97
-
98
-
99
-
100
-
101
-
102
-
103
-
104
-
105
-
106
-
107
-
108
-
109
-
110
-
111
-
112
-
113
-
114
-
115
-
116
-
117
-
118
-
119
-
120
-
121
-
122
-
123
-
124
-
125
-
126
-
127
-
128
-
129
-
130
-
131
-
132
-
133
-
134
-
135
-
136
-
137
-
138
-
139
-
140
-
141
-
142
-
143
-
144
-
145
-
146
-
 147
147 -
 148
148 -
 149
149 -
 150
150 -
 151
151 -
 152
152 -
 153
153 -
 154
154 -
 155
155 -
 156
156 -
 157
157 -
 158
158 -
 159
159 -
 160
160 -
 161
161 -
 162
162 -
 163
163 -
 164
164 -
 165
165 -
 166
166 -
 167
167 -
168
-
169
-
170
-
171
-
172
 |
 |

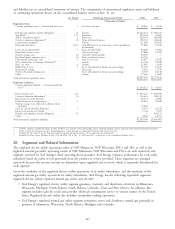
and liabilities in its consolidated statement of income. The components of unamortized regulatory assets and liabilities
of continuing operations shown on the consolidated balance sheets at Dec. 31 are:
See Note(s) Remaining Amortization Period 2008 2007
(Thousands of Dollars)
Regulatory Assets
Current regulatory asset — Unrecovered fuel costs . 1 Less than one year $ 32,843 $ 73,415
Pension and employee benefit obligations ...... 12 Various $1,212,542 $ 387,127
Net AROs(a) ....................... 1,17 Plant lives 299,294 39,891
AFDC recorded in plant(b) ............... 1 Plant lives 220,354 189,698
Contract valuation adjustments(c) ........... 14 Term of related contract 150,723 106,649
Conservation programs(b) ................ Various 117,188 119,839
Environmental costs ................... 16,17 Generally four to six years once actual expenditures 75,880 55,038
are incurred
Losses on reacquired debt ............... 1 Term of related debt 66,268 73,002
Renewable resource costs ................ One to two years 55,868 51,785
Nuclear outage costs .................. 16 Generally 18-24 months 40,690 —
Purchased power contracts costs ............ 14 Term of related contract 20,716 —
Unrecovered natural gas costs ............. 1 One to two years 14,657 22,505
State commission accounting adjustments(b) ..... Various 13,148 13,828
Rate case costs ...................... 1 Various 12,085 9,630
MISO Day 2 costs ................... 1 To be determined in future rate proceedings 11,783 12,035
Nuclear fuel storage ................... Four years 9,652 11,578
Nuclear decommissioning costs ............ To be determined in future rate proceedings 8,775 11,149
Other ........................... Various 27,656 11,689
Total noncurrent regulatory assets ............ $2,357,279 $1,115,443
Regulatory Liabilities
Current regulatory liability — Overrecovered fuel
costs(d) ......................... $ 134,212 $ 34,451
Plant removal costs ................... 1,17 $ 925,472 $ 906,996
Contract valuation adjustments(c) ........... 14 124,676 108,533
Investment tax credit deferrals ............. 68,313 72,686
Deferred income tax adjustments ........... 1 42,619 59,282
Nuclear outage costs collected in advance from
customers ....................... 13,678 —
Gain on sale of emission allowances ......... 1 8,153 21,334
Interest on income tax refunds ............ 1,736 3,472
Pension and employee benefit obligations ...... 12 —205,133
Other ........................... 9,949 12,551
Total noncurrent regulatory liabilities .......... $1,194,596 $1,389,987
(a) Includes amounts recorded for future recovery of AROs, less amounts recovered through nuclear decommissioning accruals and gains from decommissioning investments.
(b) Earns a return on investment in the ratemaking process. These amounts are amortized consistent with recovery in rates.
(c) Includes the fair value of certain long-term purchased power agreements used to meet energy capacity requirements.
(d) Included in other current liabilities of $331,419 and $268,720 at Dec. 31, 2008 and 2007, respectively, in the consolidated balance sheets.
20. Segments and Related Information
The regulated electric utility operating results of NSP-Minnesota, NSP-Wisconsin, PSCo and SPS, as well as the
regulated natural gas utility operating results of NSP-Minnesota, NSP-Wisconsin and PSCo are each separately and
regularly reviewed by Xcel Energy’s chief operating decision maker. Xcel Energy evaluates performance by each utility
subsidiary based on profit or loss generated from the product or service provided. These segments are managed
separately because the revenue streams are dependent upon regulated rate recovery, which is separately determined for
each segment.
Given the similarity of the regulated electric utility operations of its utility subsidiaries, and the similarity of the
regulated natural gas utility operations its utility subsidiaries, Xcel Energy has the following reportable segments:
regulated electric utility, regulated natural gas utility and all other.
• Xcel Energy’s regulated electric utility segment generates, transmits and distributes electricity in Minnesota,
Wisconsin, Michigan, North Dakota, South Dakota, Colorado, Texas and New Mexico. In addition, this
segment includes sales for resale and provides wholesale transmission service to various entities in the United
States. Regulated electric utility also includes commodity trading operations.
• Xcel Energy’s regulated natural gas utility segment transports, stores and distributes natural gas primarily in
portions of Minnesota, Wisconsin, North Dakota, Michigan and Colorado.
147