Xcel Energy 2008 Annual Report Download - page 123
Download and view the complete annual report
Please find page 123 of the 2008 Xcel Energy annual report below. You can navigate through the pages in the report by either clicking on the pages listed below, or by using the keyword search tool below to find specific information within the annual report.-
 1
1 -
2
-
3
-
4
-
5
-
6
-
7
-
8
-
9
-
10
-
11
-
12
-
13
-
14
-
15
-
16
-
17
-
18
-
19
-
20
-
21
-
22
-
23
-
24
-
25
-
26
-
27
-
28
-
29
-
30
-
31
-
32
-
33
-
34
-
35
-
36
-
37
-
38
-
39
-
40
-
41
-
42
-
43
-
44
-
45
-
46
-
47
-
48
-
49
-
50
-
51
-
52
-
53
-
54
-
55
-
56
-
57
-
58
-
59
-
60
-
61
-
62
-
63
-
64
-
65
-
66
-
67
-
68
-
69
-
70
-
71
-
72
-
73
-
74
-
75
-
76
-
77
-
78
-
79
-
80
-
81
-
82
-
83
-
84
-
85
-
86
-
87
-
88
-
89
-
90
-
91
-
92
-
93
-
94
-
95
-
96
-
97
-
98
-
99
-
100
-
101
-
102
-
103
-
104
-
105
-
106
-
107
-
108
-
109
-
110
-
111
-
112
-
 113
113 -
 114
114 -
 115
115 -
 116
116 -
 117
117 -
 118
118 -
 119
119 -
 120
120 -
 121
121 -
 122
122 -
 123
123 -
 124
124 -
 125
125 -
 126
126 -
 127
127 -
 128
128 -
 129
129 -
 130
130 -
 131
131 -
 132
132 -
 133
133 -
134
-
135
-
136
-
137
-
138
-
139
-
140
-
141
-
142
-
143
-
144
-
145
-
146
-
147
-
148
-
149
-
150
-
151
-
152
-
153
-
154
-
155
-
156
-
157
-
158
-
159
-
160
-
161
-
162
-
163
-
164
-
165
-
166
-
167
-
168
-
169
-
170
-
171
-
172
 |
 |

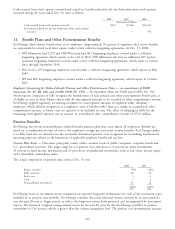
Benefit Obligations — A comparison of the actuarially computed benefit obligation and plan assets for Xcel Energy
postretirement health care plans that benefit employees of its utility subsidiaries is presented in the following table:
2008 2007
(Thousands of Dollars)
Change in Benefit Obligation:
Obligation at Jan. 1 .................................................... $830,315 $ 918,693
Service cost ......................................................... 5,350 5,813
Interest cost ......................................................... 51,047 50,475
Medicare subsidy reimbursements ............................................ 6,178 2,526
Plan participants’ contributions ............................................. 13,892 13,211
Actuarial gain ........................................................ (46,827) (86,576)
Benefit payments ...................................................... (65,358) (73,827)
Obligation at Dec. 31 ................................................... $794,597 $ 830,315
Change in Fair Value of Plan Assets:
Fair value of plan assets at Jan. 1 ............................................ $427,459 $ 406,305
Actual (loss) return on plan assets ............................................ (132,226) 24,623
Plan participants’ contributions ............................................. 13,892 13,211
Employer contributions .................................................. 55,799 57,147
Benefit payments ...................................................... (65,358) (73,827)
Fair value of plan assets at Dec. 31 ........................................... $299,566 $ 427,459
Funded Status at Dec. 31:
Funded status ........................................................ $(495,031) $(402,856)
Current liabilities ...................................................... (4,928) (1,755)
Noncurrent liabilities ................................................... (490,103) (401,101)
Net amounts recognized on consolidated balance sheets .............................. $(495,031) $(402,856)
Amounts Not Yet Recognized as Components of Net Periodic Benefit Cost:
Net loss ............................................................ $305,844 $ 202,748
Prior service credit ..................................................... (9,205) (11,380)
Transition obligation .................................................... 58,479 73,056
Total ............................................................. $355,118 $ 264,424
SFAS No. 158 Amounts Have Been Recorded as Follows Based upon Expected Recovery in Rates:
Regulatory assets ...................................................... $343,662 $ 154,661
Regulatory liabilities .................................................... — 97,835
Deferred income taxes ................................................... 4,659 5,184
Net-of-tax accumulated other comprehensive income ................................ 6,797 6,744
Total ............................................................. $355,118 $ 264,424
Measurement Date ..................................................... Dec. 31, 2008 Dec. 31, 2007
Significant Assumptions Used to Measure Benefit Obligations:
Discount rate for year-end valuation .......................................... 6.75% 6.25%
Mortality table ....................................................... RP 2000 RP 2000
Effective Dec. 31, 2008, Xcel Energy reduced its initial medical trend assumption from 8.0 percent to 7.4 percent. The
ultimate trend assumption remained unchanged at 5.0 percent. The period until the ultimate rate is reached is five
years. Xcel Energy bases its medical trend assumption on the long-term cost inflation expected in the health care
market, considering the levels projected and recommended by industry experts, as well as recent actual medical cost
increases experienced by Xcel Energy’s retiree medical plan.
A 1-percent change in the assumed health care cost trend rate would have the following effects:
(Thousands of Dollars)
1-percent increase in APBO components at Dec. 31, 2008 ....................... $80,774
1-percent decrease in APBO components at Dec. 31, 2008 ....................... (68,163)
1-percent increase in service and interest components of the net periodic cost ........... 7,069
1-percent decrease in service and interest components of the net periodic cost ........... (5,835)
113