Xcel Energy 2008 Annual Report Download - page 167
Download and view the complete annual report
Please find page 167 of the 2008 Xcel Energy annual report below. You can navigate through the pages in the report by either clicking on the pages listed below, or by using the keyword search tool below to find specific information within the annual report.-
 1
1 -
2
-
3
-
4
-
5
-
6
-
7
-
8
-
9
-
10
-
11
-
12
-
13
-
14
-
15
-
16
-
17
-
18
-
19
-
20
-
21
-
22
-
23
-
24
-
25
-
26
-
27
-
28
-
29
-
30
-
31
-
32
-
33
-
34
-
35
-
36
-
37
-
38
-
39
-
40
-
41
-
42
-
43
-
44
-
45
-
46
-
47
-
48
-
49
-
50
-
51
-
52
-
53
-
54
-
55
-
56
-
57
-
58
-
59
-
60
-
61
-
62
-
63
-
64
-
65
-
66
-
67
-
68
-
69
-
70
-
71
-
72
-
73
-
74
-
75
-
76
-
77
-
78
-
79
-
80
-
81
-
82
-
83
-
84
-
85
-
86
-
87
-
88
-
89
-
90
-
91
-
92
-
93
-
94
-
95
-
96
-
97
-
98
-
99
-
100
-
101
-
102
-
103
-
104
-
105
-
106
-
107
-
108
-
109
-
110
-
111
-
112
-
113
-
114
-
115
-
116
-
117
-
118
-
119
-
120
-
121
-
122
-
123
-
124
-
125
-
126
-
127
-
128
-
129
-
130
-
131
-
132
-
133
-
134
-
135
-
136
-
137
-
138
-
139
-
140
-
141
-
142
-
143
-
144
-
145
-
146
-
147
-
148
-
149
-
150
-
151
-
152
-
153
-
154
-
155
-
156
-
 157
157 -
 158
158 -
 159
159 -
 160
160 -
 161
161 -
 162
162 -
 163
163 -
 164
164 -
 165
165 -
 166
166 -
 167
167 -
 168
168 -
 169
169 -
 170
170 -
 171
171 -
 172
172
 |
 |

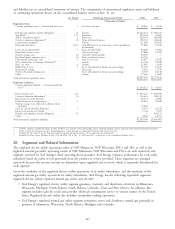
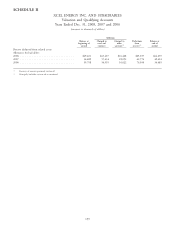
CONDENSED FINANCIAL STATEMENTS OF XCEL ENERGY INC.
Balance Sheets
(amounts in thousands of dollars)
2008 2007
Assets
Cash and cash equivalents .............................................. $ 51,778 $ 3,161
Accounts receivable from subsidiaries ........................................ 275,077 187,522
Other current assets .................................................. 6,573 29,313
Total current assets ................................................. 333,428 219,996
Investment in subsidiaries .............................................. 8,465,003 7,790,574
Other assets ....................................................... 61,675 40,460
Noncurrent assets related to discontinued operations .............................. 15,914 16,926
Total other assets .................................................. 8,542,592 7,847,960
Total assets .................................................... $8,876,020 $8,067,956
Liabilities and Equity
Dividends payable ................................................... $ 108,838 $ 99,681
Short-term debt ..................................................... 350,250 602,962
Other current liabilities ................................................ 23,493 49,396
Current liabilities related to discontinued operations .............................. — 535
Total current liabilities ............................................... 482,581 752,574
Other liabilities ..................................................... 25,440 11,786
Long-term debt ..................................................... 1,299,278 897,614
Preferred stockholder’s equity ............................................ 104,980 104,980
Common stockholder’s equity ............................................ 6,963,741 6,301,002
Total capitalization ................................................. 8,367,999 7,303,596
Total liabilities and equity ........................................... $8,876,020 $8,067,956
157