Xcel Energy 2008 Annual Report Download - page 68
Download and view the complete annual report
Please find page 68 of the 2008 Xcel Energy annual report below. You can navigate through the pages in the report by either clicking on the pages listed below, or by using the keyword search tool below to find specific information within the annual report.-
 1
1 -
2
-
3
-
4
-
5
-
6
-
7
-
8
-
9
-
10
-
11
-
12
-
13
-
14
-
15
-
16
-
17
-
18
-
19
-
20
-
21
-
22
-
23
-
24
-
25
-
26
-
27
-
28
-
29
-
30
-
31
-
32
-
33
-
34
-
35
-
36
-
37
-
38
-
39
-
40
-
41
-
42
-
43
-
44
-
45
-
46
-
47
-
48
-
49
-
50
-
51
-
52
-
53
-
54
-
55
-
56
-
57
-
 58
58 -
 59
59 -
 60
60 -
 61
61 -
 62
62 -
 63
63 -
 64
64 -
 65
65 -
 66
66 -
 67
67 -
 68
68 -
 69
69 -
 70
70 -
 71
71 -
 72
72 -
 73
73 -
 74
74 -
 75
75 -
 76
76 -
 77
77 -
 78
78 -
79
-
80
-
81
-
82
-
83
-
84
-
85
-
86
-
87
-
88
-
89
-
90
-
91
-
92
-
93
-
94
-
95
-
96
-
97
-
98
-
99
-
100
-
101
-
102
-
103
-
104
-
105
-
106
-
107
-
108
-
109
-
110
-
111
-
112
-
113
-
114
-
115
-
116
-
117
-
118
-
119
-
120
-
121
-
122
-
123
-
124
-
125
-
126
-
127
-
128
-
129
-
130
-
131
-
132
-
133
-
134
-
135
-
136
-
137
-
138
-
139
-
140
-
141
-
142
-
143
-
144
-
145
-
146
-
147
-
148
-
149
-
150
-
151
-
152
-
153
-
154
-
155
-
156
-
157
-
158
-
159
-
160
-
161
-
162
-
163
-
164
-
165
-
166
-
167
-
168
-
169
-
170
-
171
-
172
 |
 |

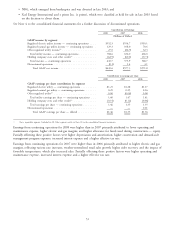
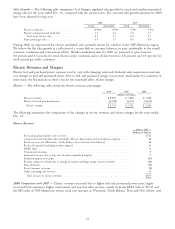
Natural Gas Margin
2008 vs. 2007 2007 vs. 2006
(Millions of Dollars)
Base rate changes — Colorado and Wisconsin ......................... $24 $21
Estimated impact of weather .................................... 10 16
Sales growth (excluding weather impact) ............................. 5 2
Conservation revenues ........................................ 3 2
Increased margin due to leap year (weather normalized impact) ............... 1 —
Transportation ............................................. (1) 6
Other .................................................. 4 6
Total increase in natural gas margin .............................. $46 $53
2008 Comparison to 2007 — Natural gas margins increased due to base rate increases for Wisconsin in January 2008
and Phase I rates in Colorado since July 2007.
2007 Comparison to 2006 — Natural gas margins increased due to interim rate increases, which were effective for
Minnesota in January 2007, and base rate increases for Colorado and North Dakota customers in July 2007.
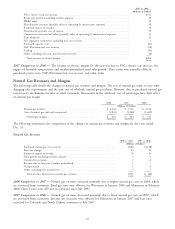
Non-Fuel Operating Expenses and Other Items
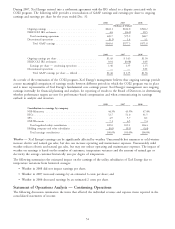
Other Operating and Maintenance Expenses
2008 vs. 2007
(Millions of Dollars)
Nuclear outage expenses, net of deferral ..................................... $(13)
Higher allowance for bad debts .......................................... 7
Lower employee benefit costs ............................................ (39)
Higher plant generation costs ............................................ 9
Higher consulting costs ............................................... 7
Higher material costs ................................................. 2
Higher contract labor costs ............................................. 4
Higher labor costs ................................................... 22
Other, including nuclear plant operation costs ................................. (10)
Total decrease in other operating and maintenance expenses ....................... $(11)
2008 Comparison to 2007 — The decrease in operating and maintenance expenses for 2008 was largely driven by the
following:
• The decline in nuclear outage expense is due to the MPUC, NDPSC, and SDPUC approving the change in recovery
methods for costs associated with refueling outages at Xcel Energy’s nuclear plants from the direct expense method to
the deferral and amortization method, effective Jan. 1, 2008. An accrual was also recorded to lower revenue,
reflecting a liability for a customer refund relating to this decision.
• Lower employee benefit costs are due to eliminating our annual performance based incentive plan payout for 2008.
• The higher plant generation costs were primarily attributable to scheduled and unplanned maintenance.
• The increase in labor costs was attributable to annual wage increases, the in sourcing of certain functions and
additional employees to support system growth.
58