Xcel Energy 2008 Annual Report Download - page 65
Download and view the complete annual report
Please find page 65 of the 2008 Xcel Energy annual report below. You can navigate through the pages in the report by either clicking on the pages listed below, or by using the keyword search tool below to find specific information within the annual report.-
 1
1 -
2
-
3
-
4
-
5
-
6
-
7
-
8
-
9
-
10
-
11
-
12
-
13
-
14
-
15
-
16
-
17
-
18
-
19
-
20
-
21
-
22
-
23
-
24
-
25
-
26
-
27
-
28
-
29
-
30
-
31
-
32
-
33
-
34
-
35
-
36
-
37
-
38
-
39
-
40
-
41
-
42
-
43
-
44
-
45
-
46
-
47
-
48
-
49
-
50
-
51
-
52
-
53
-
54
-
 55
55 -
 56
56 -
 57
57 -
 58
58 -
 59
59 -
 60
60 -
 61
61 -
 62
62 -
 63
63 -
 64
64 -
 65
65 -
 66
66 -
 67
67 -
 68
68 -
 69
69 -
 70
70 -
 71
71 -
 72
72 -
 73
73 -
 74
74 -
 75
75 -
76
-
77
-
78
-
79
-
80
-
81
-
82
-
83
-
84
-
85
-
86
-
87
-
88
-
89
-
90
-
91
-
92
-
93
-
94
-
95
-
96
-
97
-
98
-
99
-
100
-
101
-
102
-
103
-
104
-
105
-
106
-
107
-
108
-
109
-
110
-
111
-
112
-
113
-
114
-
115
-
116
-
117
-
118
-
119
-
120
-
121
-
122
-
123
-
124
-
125
-
126
-
127
-
128
-
129
-
130
-
131
-
132
-
133
-
134
-
135
-
136
-
137
-
138
-
139
-
140
-
141
-
142
-
143
-
144
-
145
-
146
-
147
-
148
-
149
-
150
-
151
-
152
-
153
-
154
-
155
-
156
-
157
-
158
-
159
-
160
-
161
-
162
-
163
-
164
-
165
-
166
-
167
-
168
-
169
-
170
-
171
-
172
 |
 |

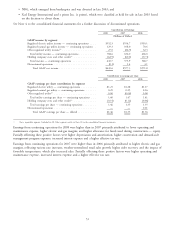
Sales Growth — The following table summarizes Xcel Energy’s regulated sales growth for actual and weather-normalized
energy sales for the years ended Dec. 31, compared with the previous year. The year-end sales growth amounts for 2008
have been adjusted for leap year.
2008 2007
Actual Normalized Actual Normalized
Electric residential ...................... (2.0)% 0.0% 3.0% 1.9%
Electric commercial and industrial ............ 1.5 2.4 1.8 1.7
Total retail electric sales ................. 0.5 1.7 2.0 1.7
Firm natural gas sales .................... 4.9 1.9 8.6 0.8
During 2008, we experienced flat electric residential sales, primarily driven by a decline in the NSP-Minnesota region.
We believe the flat sales growth is a reflection of a recent shift in customer behavior, in part, attributable to the overall
economic conditions and conservation efforts. Weather-normalized sales for 2009 are projected to grow between
0.0 percent and 0.5 percent for retail electric utility customers and to decline between (1.0) percent and 0.0 percent for
retail natural gas utility customers.
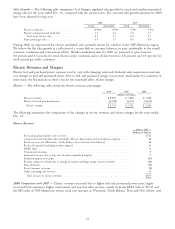
Electric Revenues and Margins
Electric fuel and purchased power expenses tend to vary with changing retail and wholesale sales requirements and unit
cost changes in fuel and purchased power. Due to fuel and purchased energy cost-recovery mechanisms for customers in
most states, the fluctuations in these costs do not materially affect electric margin.
Electric — The following tables detail the electric revenues and margin:
2008 2007 2006
(Millions of Dollars)
Electric revenues ................................. $8,683 $ 7,848 $ 7,608
Electric fuel and purchased power ....................... (4,948) (4,137) (4,103)
Electric margin ................................. $3,735 $ 3,711 $ 3,505
The following summarizes the components of the changes in electric revenues and electric margin for the years ended
Dec. 31:
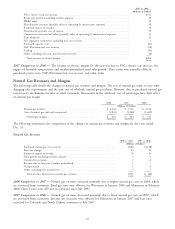
Electric Revenues
2008 vs. 2007
(Millions of Dollars)
Fuel and purchased power cost recovery ..................................... $722
Conservation and non-fuel riders (partially offset in depreciation and amortization expense) ..... 48
Retail rate increases (Wisconsin, North Dakota, Texas interim, New Mexico) .............. 48
Retail sales growth (excluding weather impact) ................................. 30
MERP rider ...................................................... 23
Transmission revenues ................................................ 9
Increased revenues due to leap year (weather normalized impact) ...................... 9
Estimated impact of weather ............................................ (49)
Revenue subject to refund due to change in nuclear refueling outage recovery method ........ (18)
Firm wholesale ..................................................... (10)
Retail customer sales mix .............................................. (8)
Other, including fuel recovery ........................................... 31
Total increase in electric revenues ........................................ $835
2008 Comparison with 2007 — Electric revenues increased due to higher fuel and purchased power costs, largely
recovered from customers, higher conservation and non-fuel rider recovery, mostly from the RESA rider at PSCO and
the RES rider at NSP-Minnesota, electric retail rate increases in Wisconsin, North Dakota, Texas and New Mexico and
55