Xcel Energy 2008 Annual Report Download - page 80
Download and view the complete annual report
Please find page 80 of the 2008 Xcel Energy annual report below. You can navigate through the pages in the report by either clicking on the pages listed below, or by using the keyword search tool below to find specific information within the annual report.-
 1
1 -
2
-
3
-
4
-
5
-
6
-
7
-
8
-
9
-
10
-
11
-
12
-
13
-
14
-
15
-
16
-
17
-
18
-
19
-
20
-
21
-
22
-
23
-
24
-
25
-
26
-
27
-
28
-
29
-
30
-
31
-
32
-
33
-
34
-
35
-
36
-
37
-
38
-
39
-
40
-
41
-
42
-
43
-
44
-
45
-
46
-
47
-
48
-
49
-
50
-
51
-
52
-
53
-
54
-
55
-
56
-
57
-
58
-
59
-
60
-
61
-
62
-
63
-
64
-
65
-
66
-
67
-
68
-
69
-
 70
70 -
 71
71 -
 72
72 -
 73
73 -
 74
74 -
 75
75 -
 76
76 -
 77
77 -
 78
78 -
 79
79 -
 80
80 -
 81
81 -
 82
82 -
 83
83 -
 84
84 -
 85
85 -
 86
86 -
 87
87 -
 88
88 -
 89
89 -
 90
90 -
91
-
92
-
93
-
94
-
95
-
96
-
97
-
98
-
99
-
100
-
101
-
102
-
103
-
104
-
105
-
106
-
107
-
108
-
109
-
110
-
111
-
112
-
113
-
114
-
115
-
116
-
117
-
118
-
119
-
120
-
121
-
122
-
123
-
124
-
125
-
126
-
127
-
128
-
129
-
130
-
131
-
132
-
133
-
134
-
135
-
136
-
137
-
138
-
139
-
140
-
141
-
142
-
143
-
144
-
145
-
146
-
147
-
148
-
149
-
150
-
151
-
152
-
153
-
154
-
155
-
156
-
157
-
158
-
159
-
160
-
161
-
162
-
163
-
164
-
165
-
166
-
167
-
168
-
169
-
170
-
171
-
172
 |
 |

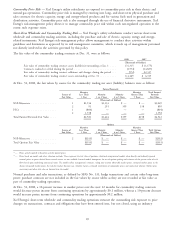
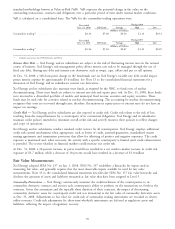
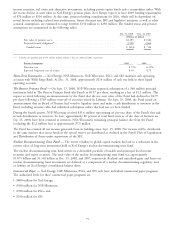
standard methodology known as Value-at-Risk (VaR). VaR expresses the potential change in fair value on the
outstanding transactions, contracts and obligations over a particular period of time under normal market conditions.
VaR is calculated on a consolidated basis. The VaRs for the commodity trading operations were:
During 2008
Year ended
Dec. 31, 2008 VaR Limit Average High Low
(Millions of Dollars)
Commodity trading(a) ...................... $0.30 $5.00 $0.30 $1.14 $0.01
During 2007
Year ended
Dec. 31, 2007 VaR Limit Average High Low
(Millions of Dollars)
Commodity trading(a) ...................... $0.26 $5.00 $0.47 $1.45 $0.09
(a) Includes transactions for NSP-Minnesota and PSCo.
Interest Rate Risk — Xcel Energy and its subsidiaries are subject to the risk of fluctuating interest rates in the normal
course of business. Xcel Energy’s risk management policy allows interest rate risk to be managed through the use of
fixed rate debt, floating rate debt and interest rate derivatives such as swaps, caps, collars and put or call options.
At Dec. 31, 2008, a 100-basis-point change in the benchmark rate on Xcel Energy’s variable rate debt would impact
pretax interest expense by approximately $5.6 million. See Note 13 to the consolidated financial statements for a
discussion of Xcel Energy and its subsidiaries’ interest rate derivatives.
Xcel Energy and its subsidiaries also maintain trust funds, as required by the NRC, to fund costs of nuclear
decommissioning. These trust funds are subject to interest rate risk and equity price risk. At Dec. 31, 2008, these funds
were invested in a diversified portfolio of taxable and municipal fixed income securities and equity securities. These
funds may be used only for activities related to nuclear decommissioning. The accounting for nuclear decommissioning
recognizes that costs are recovered through rates; therefore, fluctuations in equity prices or interest rates do not have an
impact on earnings.
Credit Risk — Xcel Energy and its subsidiaries are also exposed to credit risk. Credit risk relates to the risk of loss
resulting from the nonperformance by a counterparty of its contractual obligations. Xcel Energy and its subsidiaries
maintain credit policies intended to minimize overall credit risk and actively monitor these policies to reflect changes
and scope of operations.
Xcel Energy and its subsidiaries conduct standard credit reviews for all counterparties. Xcel Energy employs additional
credit risk control mechanisms when appropriate, such as letters of credit, parental guarantees, standardized master
netting agreements and termination provisions that allow for offsetting of positive and negative exposures. The credit
exposure is monitored and, when necessary, the activity with a specific counterparty is limited until credit enhancement
is provided. The recent volatility in financial markets could increase our credit risk.
At Dec. 31, 2008, a 10-percent increase in prices would have resulted in a net mark-to-market increase in credit risk
exposure of $1.7 million, while a decrease of 10 percent would have resulted in a decrease of $1.0 million.
Fair Value Measurements
Xcel Energy adopted SFAS No. 157 on Jan. 1, 2008. SFAS No. 157 establishes a hierarchy for inputs used in
measuring fair value, and generally requires that the most observable inputs available be used for fair value
measurements. Note 15 to the consolidated financial statements describes the SFAS No. 157 fair value hierarchy and
discloses the amounts of assets and liabilities measured at fair value that have been assigned to Level 3.
Commodity Derivatives — Xcel Energy continuously monitors the creditworthiness of the counterparties to its
commodity derivative contracts and assesses each counterparty’s ability to perform on the transactions set forth in the
contracts. Given this assessment and the typically short duration of these contracts, the impact of discounting
commodity derivative assets for counterparty credit risk was immaterial to the fair value of commodity derivative assets
at Dec. 31, 2008. Adjustments to fair value for credit risk of commodity trading instruments are recorded in electric
utility revenues. Credit risk adjustments for short-term wholesale instruments are deferred as regulatory assets and
liabilities, reflecting the impact of regulatory recovery.
70