Xcel Energy 2008 Annual Report Download - page 38
Download and view the complete annual report
Please find page 38 of the 2008 Xcel Energy annual report below. You can navigate through the pages in the report by either clicking on the pages listed below, or by using the keyword search tool below to find specific information within the annual report.-
 1
1 -
2
-
3
-
4
-
5
-
6
-
7
-
8
-
9
-
10
-
11
-
12
-
13
-
14
-
15
-
16
-
17
-
18
-
19
-
20
-
21
-
22
-
23
-
24
-
25
-
26
-
27
-
 28
28 -
 29
29 -
 30
30 -
 31
31 -
 32
32 -
 33
33 -
 34
34 -
 35
35 -
 36
36 -
 37
37 -
 38
38 -
 39
39 -
 40
40 -
 41
41 -
 42
42 -
 43
43 -
 44
44 -
 45
45 -
 46
46 -
 47
47 -
 48
48 -
49
-
50
-
51
-
52
-
53
-
54
-
55
-
56
-
57
-
58
-
59
-
60
-
61
-
62
-
63
-
64
-
65
-
66
-
67
-
68
-
69
-
70
-
71
-
72
-
73
-
74
-
75
-
76
-
77
-
78
-
79
-
80
-
81
-
82
-
83
-
84
-
85
-
86
-
87
-
88
-
89
-
90
-
91
-
92
-
93
-
94
-
95
-
96
-
97
-
98
-
99
-
100
-
101
-
102
-
103
-
104
-
105
-
106
-
107
-
108
-
109
-
110
-
111
-
112
-
113
-
114
-
115
-
116
-
117
-
118
-
119
-
120
-
121
-
122
-
123
-
124
-
125
-
126
-
127
-
128
-
129
-
130
-
131
-
132
-
133
-
134
-
135
-
136
-
137
-
138
-
139
-
140
-
141
-
142
-
143
-
144
-
145
-
146
-
147
-
148
-
149
-
150
-
151
-
152
-
153
-
154
-
155
-
156
-
157
-
158
-
159
-
160
-
161
-
162
-
163
-
164
-
165
-
166
-
167
-
168
-
169
-
170
-
171
-
172
 |
 |
NATURAL GAS UTILITY OPERATIONS
Natural Gas Utility Trends
The most significant recent developments in the natural gas operations of the utility subsidiaries are continued volatility
in natural gas market prices and the continued trend of declining use per residential customer as a result of improved
building construction technologies, higher appliance efficiencies, and conservation. From 1998 to 2008, average annual
sales to the typical residential customer declined from 97 MMBtu per year to 83 MMBtu per year on a weather-
normalized basis. Although wholesale price increases do not directly affect earnings because of natural gas cost recovery
mechanisms, the high prices can encourage further efficiency efforts by customers.
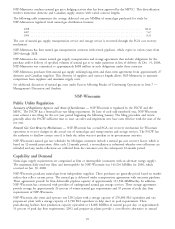
NSP-Minnesota
Public Utility Regulation
Summary of Regulatory Agencies and Areas of Jurisdiction — Retail rates, services and other aspects of NSP-Minnesota’s
operations are regulated by the MPUC and the NDPSC within their respective states. The MPUC has regulatory
authority over aspects of NSP-Minnesota’s financial activities, including security issuances, certain property transfers,
mergers with other utilities and transactions between NSP-Minnesota and its affiliates. In addition, the MPUC reviews
and approves NSP-Minnesota’s natural gas supply plans for meeting customers’ future energy needs.
Purchased Gas and Conservation Cost Recovery Mechanisms — NSP-Minnesota’s retail natural gas rates for Minnesota
and North Dakota include a PGA clause that provides for prospective monthly rate adjustments to reflect the forecasted
cost of purchased natural gas. The annual difference between the natural gas costs collected through PGA rates and the
actual natural gas costs are collected or refunded over the subsequent 12-month period. The MPUC and NDPSC have
the authority to disallow recovery of certain costs if they find the utility was not prudent in its procurement activities.
NSP-Minnesota is required by Minnesota law to spend a minimum of 0.5 percent of Minnesota natural gas revenue on
conservation improvement programs. These costs are recovered through an annual cost recovery mechanism for natural
gas conservation and energy management program expenditures. This law will change to a savings-based requirement
beginning in 2010, and the costs of conservation improvement programs will continue to be recoverable through a rate
adjustment mechanism.
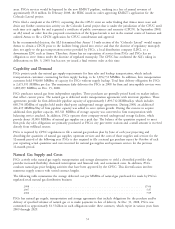
Capability and Demand
Natural gas supply requirements are categorized as firm or interruptible (customers with an alternate energy supply).
The maximum daily send-out (firm and interruptible) for NSP-Minnesota was 700,323 MMBtu for 2008, which
occurred on Dec. 16, 2008.
NSP-Minnesota purchases natural gas from independent suppliers. These purchases are generally priced based on market
indices that reflect current prices. The natural gas is delivered under transportation agreements with interstate pipelines.
These agreements provide for firm deliverable pipeline capacity of 573,668 MMBtu/day. In addition, NSP-Minnesota
has contracted with providers of underground natural gas storage services. These storage agreements provide storage for
approximately 26 percent of winter natural gas requirements and 32 percent of peak day, firm requirements of
NSP-Minnesota.
NSP-Minnesota also owns and operates one LNG plant with a storage capacity of 2.13 Bcf equivalent and three
propane-air plants with a storage capacity of 1.4 Bcf equivalent to help meet its peak requirements. These peak-shaving
facilities have production capacity equivalent to 250,300 MMBtu of natural gas per day, or approximately 33 percent of
peak day firm requirements. LNG and propane-air plants provide a cost-effective alternative to annual fixed pipeline
transportation charges to meet the peaks caused by firm space heating demand on extremely cold winter days.
NSP-Minnesota is required to file for a change in natural gas supply contract levels to meet peak demand, to
redistribute demand costs among classes, or to exchange one form of demand for another. The 2007-2008 and
2008-2009 entitlement levels are pending MPUC action.
Natural Gas Supply and Costs
NSP-Minnesota actively seeks natural gas supply, transportation and storage alternatives to yield a diversified portfolio
that provides increased flexibility, decreased interruption and financial risk, and economical rates. In addition,
28