Xcel Energy 2008 Annual Report Download - page 42
Download and view the complete annual report
Please find page 42 of the 2008 Xcel Energy annual report below. You can navigate through the pages in the report by either clicking on the pages listed below, or by using the keyword search tool below to find specific information within the annual report.-
 1
1 -
2
-
3
-
4
-
5
-
6
-
7
-
8
-
9
-
10
-
11
-
12
-
13
-
14
-
15
-
16
-
17
-
18
-
19
-
20
-
21
-
22
-
23
-
24
-
25
-
26
-
27
-
28
-
29
-
30
-
31
-
 32
32 -
 33
33 -
 34
34 -
 35
35 -
 36
36 -
 37
37 -
 38
38 -
 39
39 -
 40
40 -
 41
41 -
 42
42 -
 43
43 -
 44
44 -
 45
45 -
 46
46 -
 47
47 -
 48
48 -
 49
49 -
 50
50 -
 51
51 -
 52
52 -
53
-
54
-
55
-
56
-
57
-
58
-
59
-
60
-
61
-
62
-
63
-
64
-
65
-
66
-
67
-
68
-
69
-
70
-
71
-
72
-
73
-
74
-
75
-
76
-
77
-
78
-
79
-
80
-
81
-
82
-
83
-
84
-
85
-
86
-
87
-
88
-
89
-
90
-
91
-
92
-
93
-
94
-
95
-
96
-
97
-
98
-
99
-
100
-
101
-
102
-
103
-
104
-
105
-
106
-
107
-
108
-
109
-
110
-
111
-
112
-
113
-
114
-
115
-
116
-
117
-
118
-
119
-
120
-
121
-
122
-
123
-
124
-
125
-
126
-
127
-
128
-
129
-
130
-
131
-
132
-
133
-
134
-
135
-
136
-
137
-
138
-
139
-
140
-
141
-
142
-
143
-
144
-
145
-
146
-
147
-
148
-
149
-
150
-
151
-
152
-
153
-
154
-
155
-
156
-
157
-
158
-
159
-
160
-
161
-
162
-
163
-
164
-
165
-
166
-
167
-
168
-
169
-
170
-
171
-
172
 |
 |

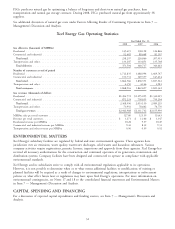
PSCo purchases natural gas by optimizing a balance of long-term and short-term natural gas purchases, firm
transportation and natural gas storage contracts. During 2008, PSCo purchased natural gas from approximately 38
suppliers.
See additional discussion of natural gas costs under Factors Affecting Results of Continuing Operations in Item 7 —
Management’s Discussion and Analysis.
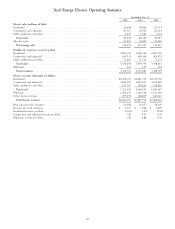
Xcel Energy Gas Operating Statistics
Year Ended Dec. 31,
2008 2007 2006
Gas deliveries (thousands of MMBtu)
Residential ..................................................... 145,615 138,198 126,846
Commercial and industrial ........................................... 92,682 88,668 81,107
Total retail .................................................... 238,297 226,866 207,953
Transportation and other ............................................. 133,207 133,851 135,708
Total deliveries ................................................. 371,504 360,717 343,661
Number of customers at end of period
Residential ..................................................... 1,712,835 1,688,994 1,669,747
Commercial and industrial ........................................... 151,731 149,557 147,614
Total retail .................................................... 1,864,566 1,838,551 1,817,361
Transportation and other ............................................. 4,350 4,146 3,981
Total customers ................................................. 1,868,916 1,842,697 1,821,342
Gas revenues (thousands of dollars)
Residential ..................................................... $1,496,772 $1,295,095 $1,330,025
Commercial and industrial ........................................... 872,224 738,035 755,204
Total retail .................................................... 2,368,996 2,033,130 2,085,229
Transportation and other ............................................. 73,992 78,602 70,770
Total gas revenues ............................................... $2,442,988 $2,111,732 $2,155,999
MMBtu sales per retail customer ........................................ 127.80 123.39 114.43
Revenue per retail customer ........................................... $ 1,271 $ 1,106 $ 1,147
Residential revenue per MMBtu ........................................ 10.28 9.37 10.49
Commercial and industrial revenue per MMBtu .............................. 9.41 8.32 9.31
Transportation and other revenue per MMBtu ............................... 0.56 0.59 0.52
ENVIRONMENTAL MATTERS
Xcel Energy’s subsidiary facilities are regulated by federal and state environmental agencies. These agencies have
jurisdiction over air emissions, water quality, wastewater discharges, solid wastes and hazardous substances. Various
company activities require registrations, permits, licenses, inspections and approvals from these agencies. Xcel Energy has
received all necessary authorizations for the construction and continued operation of its generation, transmission and
distribution systems. Company facilities have been designed and constructed to operate in compliance with applicable
environmental standards.
Xcel Energy and its subsidiaries strive to comply with all environmental regulations applicable to its operations.
However, it is not possible to determine when or to what extent additional facilities or modifications of existing or
planned facilities will be required as a result of changes to environmental regulations, interpretations or enforcement
policies or, what effect future laws or regulations may have upon Xcel Energy’s operations. For more information on
environmental contingencies, see Notes 17 and 18 to the consolidated financial statements and Environmental Matters
in Item 7 — Management’s Discussion and Analysis.
CAPITAL SPENDING AND FINANCING
For a discussion of expected capital expenditures and funding sources, see Item 7 — Management’s Discussion and
Analysis.
32