Xcel Energy 2008 Annual Report Download - page 25
Download and view the complete annual report
Please find page 25 of the 2008 Xcel Energy annual report below. You can navigate through the pages in the report by either clicking on the pages listed below, or by using the keyword search tool below to find specific information within the annual report.-
 1
1 -
2
-
3
-
4
-
5
-
6
-
7
-
8
-
9
-
10
-
11
-
12
-
13
-
14
-
 15
15 -
 16
16 -
 17
17 -
 18
18 -
 19
19 -
 20
20 -
 21
21 -
 22
22 -
 23
23 -
 24
24 -
 25
25 -
 26
26 -
 27
27 -
 28
28 -
 29
29 -
 30
30 -
 31
31 -
 32
32 -
 33
33 -
 34
34 -
 35
35 -
36
-
37
-
38
-
39
-
40
-
41
-
42
-
43
-
44
-
45
-
46
-
47
-
48
-
49
-
50
-
51
-
52
-
53
-
54
-
55
-
56
-
57
-
58
-
59
-
60
-
61
-
62
-
63
-
64
-
65
-
66
-
67
-
68
-
69
-
70
-
71
-
72
-
73
-
74
-
75
-
76
-
77
-
78
-
79
-
80
-
81
-
82
-
83
-
84
-
85
-
86
-
87
-
88
-
89
-
90
-
91
-
92
-
93
-
94
-
95
-
96
-
97
-
98
-
99
-
100
-
101
-
102
-
103
-
104
-
105
-
106
-
107
-
108
-
109
-
110
-
111
-
112
-
113
-
114
-
115
-
116
-
117
-
118
-
119
-
120
-
121
-
122
-
123
-
124
-
125
-
126
-
127
-
128
-
129
-
130
-
131
-
132
-
133
-
134
-
135
-
136
-
137
-
138
-
139
-
140
-
141
-
142
-
143
-
144
-
145
-
146
-
147
-
148
-
149
-
150
-
151
-
152
-
153
-
154
-
155
-
156
-
157
-
158
-
159
-
160
-
161
-
162
-
163
-
164
-
165
-
166
-
167
-
168
-
169
-
170
-
171
-
172
 |
 |

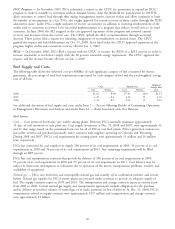
Fuel Supply and Costs
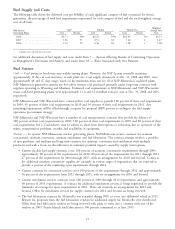
The following table shows the delivered cost per MMBtu of each significant category of fuel consumed for electric
generation, the percentage of total fuel requirements represented by each category of fuel and the total weighted average
cost of all fuels.
Weighted
Coal* Nuclear Natural Gas
NSP System Average Fuel
Generating Plants Cost Percent Cost Percent Cost Percent Cost
2008 .................. $1.73 58% $0.56 39% $10.09 3% $1.55
2007 .................. 1.56 57 0.51 38 7.60 4 1.47
2006 .................. 1.12 59 0.46 38 7.28 3 1.08
* Includes refuse-derived fuel and wood
See additional discussion of fuel supply and costs under Item 7 — Factors Affecting Results of Continuing Operations
in Management’s Discussion and Analysis and under Item 1A — Risks Associated with Our Business.
Fuel Sources
Coal — Coal inventory levels may vary widely among plants. However, the NSP System normally maintains
approximately 39 days of coal inventory at each plant site. Coal supply inventories at Dec. 31, 2008 and 2007, were
approximately 49 and 47 days usage, based on the maximum burn rate for all of NSP-Minnesota’s coal-fired plants.
NSP-Minnesota’s generation stations use low-sulfur western coal purchased primarily under long-term contracts with
suppliers operating in Wyoming and Montana. Estimated coal requirements at NSP-Minnesota’s and NSP-Wisconsin’s
major coal-fired generating plants were approximately 11.0 and 12.4 million tons per year at Dec. 31, 2008 and 2007,
respectively.
NSP-Minnesota and NSP-Wisconsin have contracted for coal supplies to provide 100 percent of their coal requirements
in 2009, 65 percent of their coal requirements in 2010 and 36 percent of their coal requirements in 2011. Any
remaining requirements will be filled through a request for proposal (RFP) process according to the fuel supply
operations procurement strategy.
NSP-Minnesota and NSP-Wisconsin have a number of coal transportation contracts that provide for delivery of
100 percent of their coal requirements in 2009, 100 percent of their coal requirements in 2010 and 28 percent of their
coal requirements 2011. Coal delivery may be subject to short-term interruptions or reductions due to operation of the
mines, transportation problems, weather and availability of equipment.
Nuclear — To operate NSP-Minnesota’s nuclear generating plants, NSP-Minnesota secures contracts for uranium
concentrates, uranium conversion, uranium enrichment and fuel fabrication. The contract strategy involves a portfolio
of spot purchases and medium and long-term contracts for uranium, conversion and enrichment with multiple
producers and with a focus on diversification to minimize potential impacts caused by supply interruptions.
• Current nuclear fuel supply contracts cover 100 percent of uranium concentrates requirements through 2009,
approximately 68 percent of the requirements for 2010, 80 percent of the requirements for 2011 through 2013,
47 percent of the requirements for 2014 through 2017, with no arrangements for 2018 and beyond. Contracts
for additional uranium concentrate supplies are currently in various stages of negotiations that are expected to
provide a portion of the remaining open requirements through 2012.
• Current contracts for conversion services cover 100 percent of the requirements through 2011 and approximately
56 percent of the requirements from 2012 through 2015, with no arrangements for 2016 and beyond.
• Current enrichment services contracts cover 100 percent of 2009 through 2012 requirements and approximately
60 percent of 2013 requirements. A contract for additional enrichment services is being negotiated to provide the
remainder of coverage for open requirements in 2013. There are currently no arrangements for 2014 and
beyond. Offers for enrichment services for supply contracts for 2014 and beyond are being reviewed.
• The fuel fabrication contract for Monticello was extended during 2007 to cover one additional reload in 2011.
Request for proposals from the fuel fabrication vendors for additional supply for Monticello were distributed.
Offers from fuel fabrication vendors are being reviewed with plans to enter into a contract with one of the
vendors in 2009. Prairie Island’s fuel fabrication is 100 percent committed to at least 2015.
15