Xcel Energy 2006 Annual Report Download - page 99
Download and view the complete annual report
Please find page 99 of the 2006 Xcel Energy annual report below. You can navigate through the pages in the report by either clicking on the pages listed below, or by using the keyword search tool below to find specific information within the annual report.-
 1
1 -
2
-
3
-
4
-
5
-
6
-
7
-
8
-
9
-
10
-
11
-
12
-
13
-
14
-
15
-
16
-
17
-
18
-
19
-
20
-
21
-
22
-
23
-
24
-
25
-
26
-
27
-
28
-
29
-
30
-
31
-
32
-
33
-
34
-
35
-
36
-
37
-
38
-
39
-
40
-
41
-
42
-
43
-
44
-
45
-
46
-
47
-
48
-
49
-
50
-
51
-
52
-
53
-
54
-
55
-
56
-
57
-
58
-
59
-
60
-
61
-
62
-
63
-
64
-
65
-
66
-
67
-
68
-
69
-
70
-
71
-
72
-
73
-
74
-
75
-
76
-
77
-
78
-
79
-
80
-
81
-
82
-
83
-
84
-
85
-
86
-
87
-
88
-
 89
89 -
 90
90 -
 91
91 -
 92
92 -
 93
93 -
 94
94 -
 95
95 -
 96
96 -
 97
97 -
 98
98 -
 99
99 -
 100
100 -
 101
101 -
 102
102 -
 103
103 -
 104
104 -
 105
105 -
 106
106 -
 107
107 -
 108
108 -
 109
109 -
110
-
111
-
112
-
113
-
114
-
115
-
116
-
117
-
118
-
119
-
120
-
121
-
122
-
123
-
124
-
125
-
126
-
127
-
128
-
129
-
130
-
131
-
132
-
133
-
134
-
135
-
136
-
137
-
138
-
139
-
140
-
141
-
142
-
143
-
144
-
145
-
146
-
147
-
148
-
149
-
150
-
151
-
152
-
153
-
154
-
155
-
156
 |
 |

89
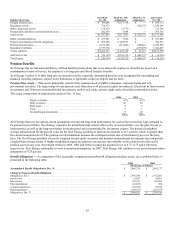
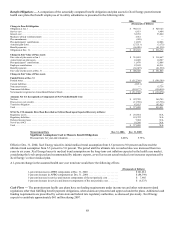
Benefit Costs — The components of net periodic postretirement benefit costs are:
2006 2005 2004
(Thousands of Dollars)
Service cost................................................... $ 6,633 $ 6,684 $ 6,100
Interest cost................................................... 52,939 55,060 52,604
Expected return on plan assets..................................... (26,757) (25,700) (23,066)
Curtailment gain ............................................... —
—
—
Settlement gain ................................................ —
—
—
Amortization of transition obligation................................ 14,444 14,578 14,578
Amortization of prior service credit................................. (2,178) (2,178) (2,179)
Amortization of net loss gain...................................... 24,797 26,246 21,651
Net periodic postretirement benefit cost under SFAS No. 106(a) ........... 69,878 74,690 69,688
Additional cost recognized due to effects of regulation.................. 3,891 3,891 3,891
Net cost recognized for financial reporting ........................... $ 73,769 $ 78,581 $ 73,579
Significant assumptions used to measure costs (income)
Discount rate .................................................. 5.75% 6.00% 6.25%
Expected average long-term rate of return on assets (pretax) ............. 7.50% 5.50-8.50% 5.50-8.50%
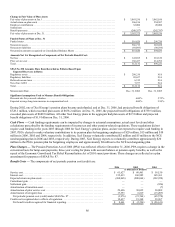
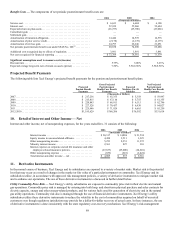
Projected Benefit Payments
The following table lists Xcel Energy’s projected benefit payments for the pension and postretirement benefit plans:
Projected
Pension Benefit
Payments
Gross Projected
Postretirement
Health Care Benefit
Payments
Expected
Medicare Part D
Subsidies
Net Projected
Postretirement
Health Care Benefit
Payments
(Thousands of Dollars)
2007....................................... $ 217,236 $ 65,355 $ 5,358 $ 59,997
2008....................................... $ 215,815 $ 67,110 $ 5,755 $ 61,355
2009....................................... $ 220,843 $ 68,911 $ 6,115 $ 62,796
2010....................................... $ 227,528 $ 70,457 $ 6,430 $ 64,027
2011....................................... $ 225,446 $ 71,924 $ 6,665 $ 65,259
2012-2016 .................................. $ 1,195,629 $ 368,206 $ 36,592 $ 331,614
10. Detail of Interest and Other Income — Net
Interest and other income, net of nonoperating expenses, for the years ended Dec. 31 consists of the following:
2006 2005 2004
(Thousands of Dollars)
Interest income................................... $ 20,317 $ 14,886 $ 21,534
Equity income in unconsolidated affiliates.............. 4,450 2,511 3,225
Other nonoperating income.......................... 5,253 8,251 11,272
Minority interest income............................ 2,361 827 310
Interest expense on corporate-owned life insurance and other
employee-related insurance policies................. (27,637) (25,000 ) (24,601)
Other nonoperating expense ......................... (659) (618 ) (2,424 )
Total interest and other income — net ................. $ 4,085 $ 857 $ 9,316
11. Derivative Instruments
In the normal course of business, Xcel Energy and its subsidiaries are exposed to a variety of market risks. Market risk is the potential
loss that may occur as a result of changes in the market or fair value of a particular instrument or commodity. Xcel Energy and its
subsidiaries utilize, in accordance with approved risk management policies, a variety of derivative instruments to mitigate market risk
and to enhance our operations. The use of these derivative instruments is discussed in further detail below.
Utility Commodity Price Risk — Xcel Energy’s utility subsidiaries are exposed to commodity price risk in their electric and natural
gas operations. Commodity price risk is managed by entering into both long- and short-term physical purchase and sales contracts for
electric capacity, energy and other energy-related products, and for various fuels used for generation of electricity and in the natural
gas utility operations. Commodity risk also is managed through the use of financial derivative instruments. Xcel Energy’s utility
subsidiaries utilize these derivative instruments to reduce the volatility in the cost of commodities acquired on behalf of our retail
customers even though regulatory jurisdiction may provide for a dollar-for-dollar recovery of actual costs. In these instances, the use
of derivative instruments is done consistently with the state regulatory cost-recovery mechanism. Xcel Energy’s risk-management