Xcel Energy 2006 Annual Report Download - page 78
Download and view the complete annual report
Please find page 78 of the 2006 Xcel Energy annual report below. You can navigate through the pages in the report by either clicking on the pages listed below, or by using the keyword search tool below to find specific information within the annual report.-
 1
1 -
2
-
3
-
4
-
5
-
6
-
7
-
8
-
9
-
10
-
11
-
12
-
13
-
14
-
15
-
16
-
17
-
18
-
19
-
20
-
21
-
22
-
23
-
24
-
25
-
26
-
27
-
28
-
29
-
30
-
31
-
32
-
33
-
34
-
35
-
36
-
37
-
38
-
39
-
40
-
41
-
42
-
43
-
44
-
45
-
46
-
47
-
48
-
49
-
50
-
51
-
52
-
53
-
54
-
55
-
56
-
57
-
58
-
59
-
60
-
61
-
62
-
63
-
64
-
65
-
66
-
67
-
 68
68 -
 69
69 -
 70
70 -
 71
71 -
 72
72 -
 73
73 -
 74
74 -
 75
75 -
 76
76 -
 77
77 -
 78
78 -
 79
79 -
 80
80 -
 81
81 -
 82
82 -
 83
83 -
 84
84 -
 85
85 -
 86
86 -
 87
87 -
 88
88 -
89
-
90
-
91
-
92
-
93
-
94
-
95
-
96
-
97
-
98
-
99
-
100
-
101
-
102
-
103
-
104
-
105
-
106
-
107
-
108
-
109
-
110
-
111
-
112
-
113
-
114
-
115
-
116
-
117
-
118
-
119
-
120
-
121
-
122
-
123
-
124
-
125
-
126
-
127
-
128
-
129
-
130
-
131
-
132
-
133
-
134
-
135
-
136
-
137
-
138
-
139
-
140
-
141
-
142
-
143
-
144
-
145
-
146
-
147
-
148
-
149
-
150
-
151
-
152
-
153
-
154
-
155
-
156
 |
 |

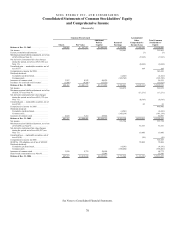
See Notes to Consolidated Financial Statements.
68
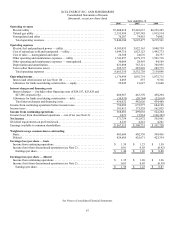
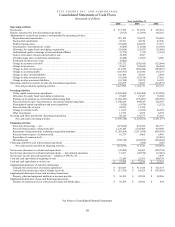
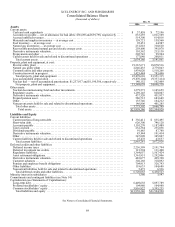
XCEL ENERGY INC. AND SUBSIDIARIES
Consolidated Statements of Cash Flows
(thousands of dollars)
Year ended Dec. 31
2006 2005 2004
Operating activities
Net income................................................................. $ 571,754 $ 512,972 $ 355,961
Remove (income) loss from discontinued operations................................. (3,073) (13,934) 166,303
Adjustments to reconcile net income to cash provided by operating activities:
Depreciation and amortization................................................ 857,129 782,074 739,025
Nuclear fuel amortization.................................................... 47,531 45,330 43,296
Deferred income taxes...................................................... (59,843) 205,058 57,273
Amortization of investment tax credits.......................................... (9,806) (11,620) (12,189)
Allowance for equity funds used during construction ............................... (25,045) (21,627) (33,648)
Undistributed equity in earnings of unconsolidated affiliates ......................... (2,775) (712) (3,342)
Gain or write down of assets sold or held for sale.................................. (6,189) 2,887
—
Unrealized gain (loss) on derivative instruments................................... (6,240) (3,923) 6,206
Settlement of interest rate swap ............................................... (8,002)
—
—
Change in accounts receivable ................................................ 176,732 (250,305) (123,044)
Change in inventories....................................................... 28,967 (94,605) (46,220)
Change in other current assets ................................................ 212,532 (289,250) (190,827)
Change in accounts payable.................................................. (105,707) 281,430 133,278
Change in other current liabilities.............................................. 135,456 30,923 2,494
Change in other noncurrent assets ............................................. (41,290) (67,138) 17,025
Change in other noncurrent liabilities ........................................... (33,390) 22,874 16,159
Operating cash flows (used in) provided by discontinued operations...................... 195,255 53,283 (314,575)
Net cash provided by operating activities ...................................... 1,923,996 1,183,717 813,175
Investing activities
Utility capital/construction expenditures......................................... (1,626,000) (1,304,468) (1,274,290)
Allowance for equity funds used during construction ............................... 25,045 21,627 33,648
Purchase of investments in external decommissioning fund.......................... (1,288,103) (576,001) (305,328)
Proceeds from the sale of investments in external decommissioning fund................ 1,240,034 494,529 228,676
Nonregulated capital expenditures and asset acquisitions............................ (1,620) (6,976) (2,122)
Proceeds from sale of assets .................................................. 24,670 11,228
—
Change in restricted cash.................................................... 11,813 (6,226) 42,628
Other investments ......................................................... 13,535 5,075 8,392
Investing cash flows provided by discontinued operations ............................. 50,516 135,577 37,119
Net cash used in investing activities .......................................... (1,550,110) (1,225,635) (1,231,277)
Financing activities
Short-term borrowings — net................................................. (119,820) 433,820 253,737
Proceeds from issuance of long-term debt ....................................... 1,326,180 2,529,408 419,848
Repayment of long-term debt, including reacquisition premiums...................... (1,285,584) (2,517,698) (438,595)
Proceeds from issuance of common stock........................................ 16,275 9,085 6,985
Repurchase of common stock.................................................
—
—
(32,023)
Dividends paid............................................................ (358,746) (343,092) (320,444)
Financing cash flows used in discontinued operations ................................
—
(200) (200)
Net cash (used in) provided by financing activities............................... (421,695) 111,323 (110,692)
Net increase (decrease) in cash and cash equivalents ................................. (47,809) 69,405 (528,794)
Net increase (decrease) in cash and cash equivalents — discontinued operations ............ 13,071 (20,570) (12,018)
Net increase in cash and cash equivalents — adoption of FIN No. 46.....................
—
—
3,439
Cash and cash equivalents at beginning of year ..................................... 72,196 23,361 560,734
Cash and cash equivalents at end of year .......................................... $ 37,458 $ 72,196 $ 23,361
Supplemental disclosure of cash flow information
Cash paid for interest (net of amounts capitalized)................................. $ 427,683 $ 417,016 $ 423,673
Cash paid for income taxes (net of refunds received) ............................... $ (13,329) $ 10,625 $ (355,639)
Supplemental disclosure of non-cash investing transactions:
Property, plant and equipment additions in accounts payable ......................... $ 54,102 $ 42,526 $ 48,306
Supplemental disclosure of non-cash financing transactions:
Issuance of common stock for reinvested dividends and 401(k) plans................... $ 56,194 $ 43,882 $ 854