Xcel Energy 2006 Annual Report Download - page 52
Download and view the complete annual report
Please find page 52 of the 2006 Xcel Energy annual report below. You can navigate through the pages in the report by either clicking on the pages listed below, or by using the keyword search tool below to find specific information within the annual report.-
 1
1 -
2
-
3
-
4
-
5
-
6
-
7
-
8
-
9
-
10
-
11
-
12
-
13
-
14
-
15
-
16
-
17
-
18
-
19
-
20
-
21
-
22
-
23
-
24
-
25
-
26
-
27
-
28
-
29
-
30
-
31
-
32
-
33
-
34
-
35
-
36
-
37
-
38
-
39
-
40
-
41
-
 42
42 -
 43
43 -
 44
44 -
 45
45 -
 46
46 -
 47
47 -
 48
48 -
 49
49 -
 50
50 -
 51
51 -
 52
52 -
 53
53 -
 54
54 -
 55
55 -
 56
56 -
 57
57 -
 58
58 -
 59
59 -
 60
60 -
 61
61 -
 62
62 -
63
-
64
-
65
-
66
-
67
-
68
-
69
-
70
-
71
-
72
-
73
-
74
-
75
-
76
-
77
-
78
-
79
-
80
-
81
-
82
-
83
-
84
-
85
-
86
-
87
-
88
-
89
-
90
-
91
-
92
-
93
-
94
-
95
-
96
-
97
-
98
-
99
-
100
-
101
-
102
-
103
-
104
-
105
-
106
-
107
-
108
-
109
-
110
-
111
-
112
-
113
-
114
-
115
-
116
-
117
-
118
-
119
-
120
-
121
-
122
-
123
-
124
-
125
-
126
-
127
-
128
-
129
-
130
-
131
-
132
-
133
-
134
-
135
-
136
-
137
-
138
-
139
-
140
-
141
-
142
-
143
-
144
-
145
-
146
-
147
-
148
-
149
-
150
-
151
-
152
-
153
-
154
-
155
-
156
 |
 |

42
Discontinued operations consist of the following:
• Quixx Corp., a major portion of which was sold in October 2006;
• Utility Engineering Corp., which was sold in April 2005;
• Seren, a portion of which was sold in November 2005 with the remainder sold in January 2006;
• Cheyenne, which was sold in January 2005;
• NRG, which emerged from bankruptcy and was divested in late 2003; and
• Xcel Energy International and e prime, which were classified as held for sale in late 2003 based on the decision to divest them.
See Note 2 to the Consolidated Financial Statements for a further discussion of discontinued operations.
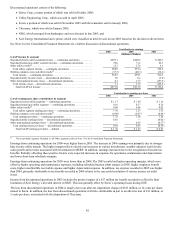
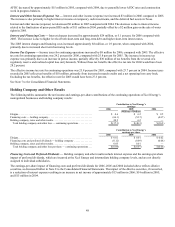
Contribution to earnings
2006 2005 2004
(Millions of Dollars)
GAAP income by segment
Regulated electric utility segment income — continuing operations.......... $ 503.1 $ 440.6 $ 466.3
Regulated natural gas utility segment income — continuing operations....... 70.6 71.2 86.1
Other utility results(a) .............................................. 32.3 27.6 6.1
Total utility segment income — continuing operations.................. 606.0 539.4 558.5
Holding company costs and other results(a) ............................. (37.3) (40.3) (36.2)
Total income — continuing operations.............................. 568.7 499.1 522.3
Regulated utility income (loss) — discontinued operations ................ 3.0 0.2 (9.0)
Other nonregulated income (loss) — discontinued operations .............. 0.1 13.7 (157.3)
Total income (loss) — discontinued operations........................ 3.1 13.9 (166.3)
Total GAAP net income ....................................... $ 571.8 $ 513.0 $ 356.0
Contribution to earnings per share
2006 2005 2004
GAAP earnings per share contribution by segment
Regulated electric utility segment — continuing operations................ $ 1.17 $ 1.04 $ 1.10
Regulated natural gas utility segment — continuing operations............. 0.16 0.17 0.20
Other utility results(a) .............................................. 0.08 0.06 0.02
Total utility segment earnings per share — continuing operations......... 1.41 1.27 1.32
Holding company costs and other results(a) ............................. (0.06) (0.07) (0.06)
Total earnings per share — continuing operations...................... 1.35 1.20 1.26
Regulated utility earnings (loss) — discontinued operations................ 0.01
—
(0.02)
Other nonregulated earnings (loss) — discontinued operations..............
—
0.03 (0.37)
Total earnings (loss) per share — discontinued operations............... 0.01 0.03 (0.39)
Total GAAP earnings per share — diluted ......................... $ 1.36 $ 1.23 $ 0.87
(a) Not a reportable segment. Included in All Other segment results in Note 17 to the Consolidated Financial Statements.
Earnings from continuing operations for 2006 were higher than in 2005. The increase in 2006 earnings was primarily due to stronger
base electric utility margin. The higher margin reflects electric rate increases in various jurisdictions, weather-adjusted retail electric
sales growth and revenue associated with investments in MERP. In addition, earnings increased due to the recognition of income tax
benefits. Partially offsetting these positive factors were expected increases in expenses for operations, maintenance and depreciation
and lower short-term wholesale margins.
Earnings from continuing operations for 2005 were lower than in 2004. The 2005 results had higher operating margins, which were
offset by higher operating and maintenance expenses, including scheduled nuclear plant outages in 2005, higher employee benefit
costs, higher uncollectible receivable expense and higher depreciation expense. In addition, tax expense recorded in 2005 was higher
than 2004, primarily attributable to tax benefits recorded in 2004 related to the successful resolution of various income tax audit
issues.
Income from discontinued operations in 2005 includes the positive impact of a $17 million tax benefit recorded to reflect the final
resolution of Xcel Energy’s divested interest in NRG. This was partially offset by Seren’s operating losses during 2005.
The loss from discontinued operations in 2004 is largely due to an after-tax impairment charge of $143 million, or 34 cents per share,
related to Seren. In addition, the loss from discontinued operations in 2004 is attributable in part to an after-tax loss of $13 million, or
3 cents per share, associated with the disposition of Cheyenne.