Xcel Energy 2006 Annual Report Download - page 66
Download and view the complete annual report
Please find page 66 of the 2006 Xcel Energy annual report below. You can navigate through the pages in the report by either clicking on the pages listed below, or by using the keyword search tool below to find specific information within the annual report.
56
Commodity Price Risk — Xcel Energy and its subsidiaries are exposed to commodity price risk in their electric and natural gas
operations. Commodity price risk is managed by entering into both long- and short-term physical purchase and sales contracts for
electric capacity, energy and energy-related products, and for various fuels used in generation and distribution activities. Commodity
price risk is also managed through the use of financial derivative instruments. Xcel Energy’s risk-management policy allows it to
manage commodity price risk within each rate-regulated operation to the extent such exposure exists, as allowed by regulation.
Short-Term Wholesale and Commodity Trading Risk — Xcel Energy’s subsidiaries conduct various short-term wholesale and
commodity trading activities, including the purchase and sale of capacity, energy and energy-related instruments. These marketing
activities have terms of generally less than one year in length. Xcel Energy’s risk-management policy allows management to conduct
these activities within guidelines and limitations as approved by its risk management committee, which is made up of management
personnel not directly involved in the activities governed by the policy.
Certain contracts and financial instruments within the scope of these activities qualify for hedge accounting treatment under SFAS
No. 133 — “Accounting for Derivative Instruments and Hedging Activities,” (SFAS No. 133).
The fair value of the commodity trading contracts as of Dec. 31, 2006, was as follows:
(Millions of Dollars)
Fair value of trading contracts outstanding at Jan. 1, 2006........................................ $ 3.9
Contracts realized or settled during the year.................................................... (18.4)
Fair value of trading contract additions and changes during the year................................ 13.3
Fair value of trading contracts outstanding at Dec. 31, 2006 ...................................... $ (1.2)
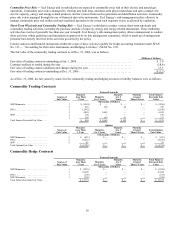
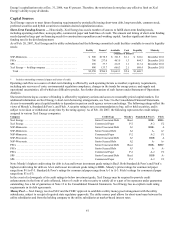
As of Dec. 31, 2006, the fair values by source for the commodity trading and hedging net asset or liability balances were as follows:
Commodity Trading Contracts
Futures/Forwards
Source of
Fair Value
Maturity
Less Than
1 Year
Maturity
1 to 3 Years
Maturity
4 to 5
Years
Maturity
Greater
Than 5 Years
Total Futures/
Forwards Fair
Value
(Thousands of Dollars)
NSP-Minnesota.................. 1 $ (1,284) $ — $
—
$ — $ (1,284)
2 226 100 44 — 370
PSCo.......................... 1 (2,642) —
—
— (2,642)
2 4,029 2,405
—
— 6,434
SPS* .......................... 1 130 —
—
— 130
2 350 160 61 — 571
Total Futures/Forwards Fair Value.... $ 809 $ 2,665 $ 105 $ — $ 3,579
Options
Source of
Fair Value
Maturity
Less Than
1 Year
Maturity
1 to 3 Years
Maturity
4 to 5
Years
Maturity
Greater
Than 5 Years
Total Options
Fair Value
(Thousands of Dollars)
NSP-Minnesota.................. 2 $ (435) $ — $
—
$ — $ (435)
PSCo.......................... 2 (4,412) —
—
— (4,412)
SPS* .......................... 2 93 —
—
— 93
Total Options Fair Value........... $ (4,754) $ — $
—
$ — $ (4,754)
Commodity Hedge Contracts
Futures/Forwards
Source of
Fair Value
Maturity
Less Than
1 Year
Maturity
1 to 3 Years
Maturity
4 to 5
Years
Maturity
Greater
Than 5 Years
Total Futures/
Forwards Fair
Value
(Thousands of Dollars)
NSP-Minnesota.................. 1 $ (2,229) $
—
$
—
$
—
$ (2,229)
2 16,420
—
—
—
16,420
PSCo.......................... 1 (166)
—
—
—
(166)
NSP-Wisconsin.................. 1 (250)
—
—
—
(250)
Total Futures/Forwards Fair Value.... $ 13,775 $
—
$
—
$
—
$ 13,775


