Xcel Energy 2006 Annual Report Download - page 80
Download and view the complete annual report
Please find page 80 of the 2006 Xcel Energy annual report below. You can navigate through the pages in the report by either clicking on the pages listed below, or by using the keyword search tool below to find specific information within the annual report.-
 1
1 -
2
-
3
-
4
-
5
-
6
-
7
-
8
-
9
-
10
-
11
-
12
-
13
-
14
-
15
-
16
-
17
-
18
-
19
-
20
-
21
-
22
-
23
-
24
-
25
-
26
-
27
-
28
-
29
-
30
-
31
-
32
-
33
-
34
-
35
-
36
-
37
-
38
-
39
-
40
-
41
-
42
-
43
-
44
-
45
-
46
-
47
-
48
-
49
-
50
-
51
-
52
-
53
-
54
-
55
-
56
-
57
-
58
-
59
-
60
-
61
-
62
-
63
-
64
-
65
-
66
-
67
-
68
-
69
-
 70
70 -
 71
71 -
 72
72 -
 73
73 -
 74
74 -
 75
75 -
 76
76 -
 77
77 -
 78
78 -
 79
79 -
 80
80 -
 81
81 -
 82
82 -
 83
83 -
 84
84 -
 85
85 -
 86
86 -
 87
87 -
 88
88 -
 89
89 -
 90
90 -
91
-
92
-
93
-
94
-
95
-
96
-
97
-
98
-
99
-
100
-
101
-
102
-
103
-
104
-
105
-
106
-
107
-
108
-
109
-
110
-
111
-
112
-
113
-
114
-
115
-
116
-
117
-
118
-
119
-
120
-
121
-
122
-
123
-
124
-
125
-
126
-
127
-
128
-
129
-
130
-
131
-
132
-
133
-
134
-
135
-
136
-
137
-
138
-
139
-
140
-
141
-
142
-
143
-
144
-
145
-
146
-
147
-
148
-
149
-
150
-
151
-
152
-
153
-
154
-
155
-
156
 |
 |

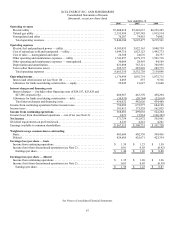
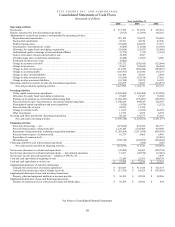
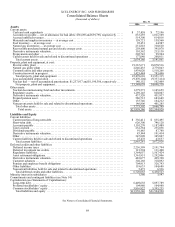
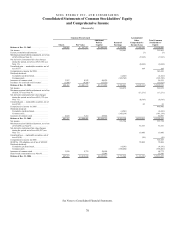
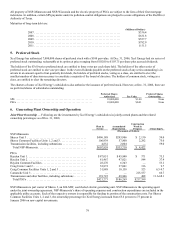
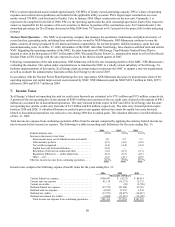
See Notes to Consolidated Financial Statements.
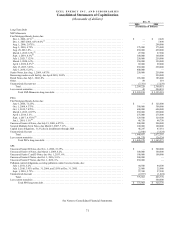
70
XCEL ENERGY INC. AND SUBSIDIARIES
Consolidated Statements of Common Stockholders’ Equity
and Comprehensive Income
(thousands)
Common Stock Issued Accumulated
Shares Par Value
Additional
Paid in
Capital
Retained
Earnings
Other
Comprehensive
Income (Loss)
Total Common
Stockholders’
Equity
Balance at Dec. 31, 2003............... 398,965 $ 997,412 $ 3,890,501 $ 368,663 $ (90,136 ) $ 5,166,440
Net income ........................ 355,961 355,961
Currency translation adjustments.......... (3 ) (3 )
Minimum pension liability adjustment, net of tax
of $(5,414) (see Note 9).............. (7,935) (7,935 )
Net derivative instrument fair value changes
during the period, net of tax of $(5,549) (see
Note 11)......................... (8,024 ) (8,024 )
Unrealized gain — marketable securities, net of
tax of $77........................ 164 164
Comprehensive income for 2004.......... 340,163
Dividends declared:
Cumulative preferred stock............ (4,241) (4,241 )
Common stock.................... (323,742) (323,742 )
Issuances of common stock ............. 3,297 8,243 48,078 56,321
Purchases for restricted stock issuance...... (1,800 ) (4,500) (27,523 ) (32,023)
Balance at Dec. 31, 2004............... 400,462 $ 1,001,155 $ 3,911,056 $ 396,641 $ (105,934 ) $ 5,202,918
Net income ........................ 512,972 512,972
Minimum pension liability adjustment, net of tax
of $(10,717) (see Note 9)............. (17,271) (17,271)
Net derivative instrument fair value changes
during the period, net of tax of $(5,137) (see
Note 11)......................... (8,919 ) (8,919 )
Unrealized gain — marketable securities, net of
tax of $41........................ 63 63
Comprehensive income for 2005.......... 486,845
Dividends declared:
Cumulative preferred stock............ (4,241) (4,241 )
Common stock.................... (343,234) (343,234 )
Issuances of common stock ............. 2,925 7,313 45,654 52,967
Balance at Dec. 31, 2005............... 403,387 $ 1,008,468 $ 3,956,710 $ 562,138 $ (132,061 ) $ 5,395,255
Net income ........................ 571,754 571,754
Minimum pension liability adjustment, net of tax
of $19,498 (see Note 9) .............. 31,957 31,957
Net derivative instrument fair value changes
during the period, net of tax of $6,297 (see
Note 11)......................... 11,000 11,000
Unrealized loss — marketable securities, net of
tax of $(18)....................... (26) (26 )
Comprehensive income for 2006.......... 614,685
SFAS No. 158 adoption, net of tax of $42,265 72,804 72,804
Dividends declared:
Cumulative preferred stock............ (4,241) (4,241 )
Common stock.................... (358,402) (358,402 )
Issuances of common stock ............. 3,910 9,774 58,998 68,772
Share-based compensation (see Note 8)..... 27,949 27,949
Balance at Dec. 31, 2006............... 407,297 $ 1,018,242 $ 4,043,657 $ 771,249 $ (16,326 ) $ 5,816,822