Xcel Energy 2006 Annual Report Download - page 124
Download and view the complete annual report
Please find page 124 of the 2006 Xcel Energy annual report below. You can navigate through the pages in the report by either clicking on the pages listed below, or by using the keyword search tool below to find specific information within the annual report.-
 1
1 -
2
-
3
-
4
-
5
-
6
-
7
-
8
-
9
-
10
-
11
-
12
-
13
-
14
-
15
-
16
-
17
-
18
-
19
-
20
-
21
-
22
-
23
-
24
-
25
-
26
-
27
-
28
-
29
-
30
-
31
-
32
-
33
-
34
-
35
-
36
-
37
-
38
-
39
-
40
-
41
-
42
-
43
-
44
-
45
-
46
-
47
-
48
-
49
-
50
-
51
-
52
-
53
-
54
-
55
-
56
-
57
-
58
-
59
-
60
-
61
-
62
-
63
-
64
-
65
-
66
-
67
-
68
-
69
-
70
-
71
-
72
-
73
-
74
-
75
-
76
-
77
-
78
-
79
-
80
-
81
-
82
-
83
-
84
-
85
-
86
-
87
-
88
-
89
-
90
-
91
-
92
-
93
-
94
-
95
-
96
-
97
-
98
-
99
-
100
-
101
-
102
-
103
-
104
-
105
-
106
-
107
-
108
-
109
-
110
-
111
-
112
-
113
-
 114
114 -
 115
115 -
 116
116 -
 117
117 -
 118
118 -
 119
119 -
 120
120 -
 121
121 -
 122
122 -
 123
123 -
 124
124 -
 125
125 -
 126
126 -
 127
127 -
 128
128 -
 129
129 -
 130
130 -
 131
131 -
 132
132 -
 133
133 -
 134
134 -
135
-
136
-
137
-
138
-
139
-
140
-
141
-
142
-
143
-
144
-
145
-
146
-
147
-
148
-
149
-
150
-
151
-
152
-
153
-
154
-
155
-
156
 |
 |

114
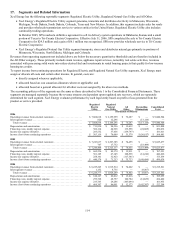
17. Segments and Related Information
Xcel Energy has the following reportable segments: Regulated Electric Utility, Regulated Natural Gas Utility and All Other.
• Xcel Energy’s Regulated Electric Utility segment generates, transmits and distributes electricity in Minnesota, Wisconsin,
Michigan, North Dakota, South Dakota, Colorado, Texas and New Mexico. In addition, this segment includes sales for resale
and provides wholesale transmission service to various entities in the United States. Regulated Electric Utility also includes
commodity trading operations.
In October 2005, SPS reached a definitive agreement to sell its delivery system operations in Oklahoma, Kansas and a small
portion of Texas to Tri-County Electric Cooperative. Effective July 31, 2006, SPS completed the sale to Tri-County Electric
Cooperative for $24.5 million and a gain of $6.1 million was recognized. SPS now provides wholesale service to Tri-County
Electric Cooperative.
• Xcel Energy’s Regulated Natural Gas Utility segment transports, stores and distributes natural gas primarily in portions of
Minnesota, Wisconsin, North Dakota, Michigan and Colorado.
Revenues from operating segments not included above are below the necessary quantitative thresholds and are therefore included in
the All Other category. Those primarily include steam revenue, appliance repair services, nonutility real estate activities, revenues
associated with processing solid waste into refuse-derived fuel and investments in rental housing projects that qualify for low-income
housing tax credits.
To report income from continuing operations for Regulated Electric and Regulated Natural Gas Utility segments, Xcel Energy must
assign or allocate all costs and certain other income. In general, costs are:
• directly assigned wherever applicable;
• allocated based on cost causation allocators wherever applicable; and
• allocated based on a general allocator for all other costs not assigned by the above two methods.
The accounting policies of the segments are the same as those described in Note 1 to the Consolidated Financial Statements. These
segments are managed separately because the revenue streams are dependent upon regulated rate recovery, which are separately
determined for each segment. Xcel Energy evaluates performance by each legal entity based on profit or loss generated from the
product or service provided.
Regulated
Electric
Utility
Regulated
Natural
Gas Utility
All
Other
Reconciling
Eliminations
Consolidated
Total
(Thousands of Dollars)
2006
Operating revenues from external customers ...................... $ 7,608,018 $ 2,155,999 $ 76,287 $
—
$ 9,840,304
Intersegment revenues....................................... 820 12,296 — (13,116) —
Total revenues........................................... $ 7,608,838 $ 2,168,295 $ 76,287 $ (13,116) $ 9,840,304
Depreciation and amortization................................. $ 711,930 $ 94,356 $ 15,612 $
—
$ 821,898
Financing costs, mainly interest expense ......................... 302,114 44,965 133,558 (24,605) 456,032
Income tax expense (benefit).................................. 283,552 37,656 (139,797 )
—
181,411
Income (loss) from continuing operations......................... $ 503,119 $ 70,609 $ 51,570 $ (56,617) $ 568,681
2005
Operating revenues from external customers ...................... $ 7,243,637 $ 2,307,385 $ 74,455 $
—
$ 9,625,477
Intersegment revenues....................................... 767 17,732 — (18,499) —
Total revenues........................................... $ 7,244,404 $ 2,325,117 $ 74,455 $ (18,499) $ 9,625,477
Depreciation and amortization................................. $ 662,236 $ 89,174 $ 15,911 $
—
$ 767,321
Financing costs, mainly interest expense ......................... 301,185 47,145 108,538 (14,242) 442,626
Income tax expense (benefit).................................. 258,161 32,923 (117,545 )
—
173,539
Income (loss) from continuing operations......................... $ 440,578 $ 71,213 $ 35,733 $ (48,486) $ 499,038
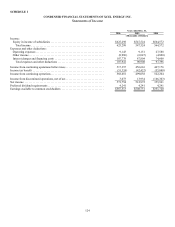
2004
Operating revenues from external customers ...................... $ 6,225,245 $ 1,915,514 $ 74,802 $
—
$ 8,215,561
Intersegment revenues....................................... 1,132 8,735 — (9,867) —
Total revenues........................................... $ 6,226,377 $ 1,924,249 $ 74,802 $ (9,867) $ 8,215,561
Depreciation and amortization................................. $ 610,127 $ 82,012 $ 13,816 $
—
$ 705,955
Financing costs, mainly interest expense ......................... 299,768 48,757 100,784 (14,829) 434,480
Income tax expense (benefit).................................. 235,743 29,286 (103,094 )
—
161,935
Income (loss) from continuing operations......................... $ 466,307 $ 86,091 $ 12,173 $ (42,307) $ 522,264