Xcel Energy 2006 Annual Report Download - page 3
Download and view the complete annual report
Please find page 3 of the 2006 Xcel Energy annual report below. You can navigate through the pages in the report by either clicking on the pages listed below, or by using the keyword search tool below to find specific information within the annual report.-
 1
1 -
 2
2 -
 3
3 -
 4
4 -
 5
5 -
 6
6 -
 7
7 -
 8
8 -
 9
9 -
 10
10 -
 11
11 -
 12
12 -
 13
13 -
 14
14 -
15
-
16
-
17
-
18
-
19
-
20
-
21
-
22
-
23
-
24
-
25
-
26
-
27
-
28
-
29
-
30
-
31
-
32
-
33
-
34
-
35
-
36
-
37
-
38
-
39
-
40
-
41
-
42
-
43
-
44
-
45
-
46
-
47
-
48
-
49
-
50
-
51
-
52
-
53
-
54
-
55
-
56
-
57
-
58
-
59
-
60
-
61
-
62
-
63
-
64
-
65
-
66
-
67
-
68
-
69
-
70
-
71
-
72
-
73
-
74
-
75
-
76
-
77
-
78
-
79
-
80
-
81
-
82
-
83
-
84
-
85
-
86
-
87
-
88
-
89
-
90
-
91
-
92
-
93
-
94
-
95
-
96
-
97
-
98
-
99
-
100
-
101
-
102
-
103
-
104
-
105
-
106
-
107
-
108
-
109
-
110
-
111
-
112
-
113
-
114
-
115
-
116
-
117
-
118
-
119
-
120
-
121
-
122
-
123
-
124
-
125
-
126
-
127
-
128
-
129
-
130
-
131
-
132
-
133
-
134
-
135
-
136
-
137
-
138
-
139
-
140
-
141
-
142
-
143
-
144
-
145
-
146
-
147
-
148
-
149
-
150
-
151
-
152
-
153
-
154
-
155
-
156
 |
 |
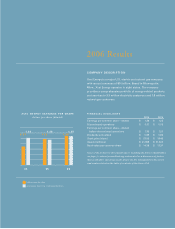
C O M PA N Y D E S C R I P T I O N
Xcel Energy is a major U.S. electric and natural gas company,
with annual revenues of $10 billion. Based in Minneapolis,
Minn., Xcel Energy operates in eight states. The company
provides a comprehensive portfolio of energy-related products
and services to 3.3 million electricity customers and 1.8 million
natural gas customers.
2006 Results
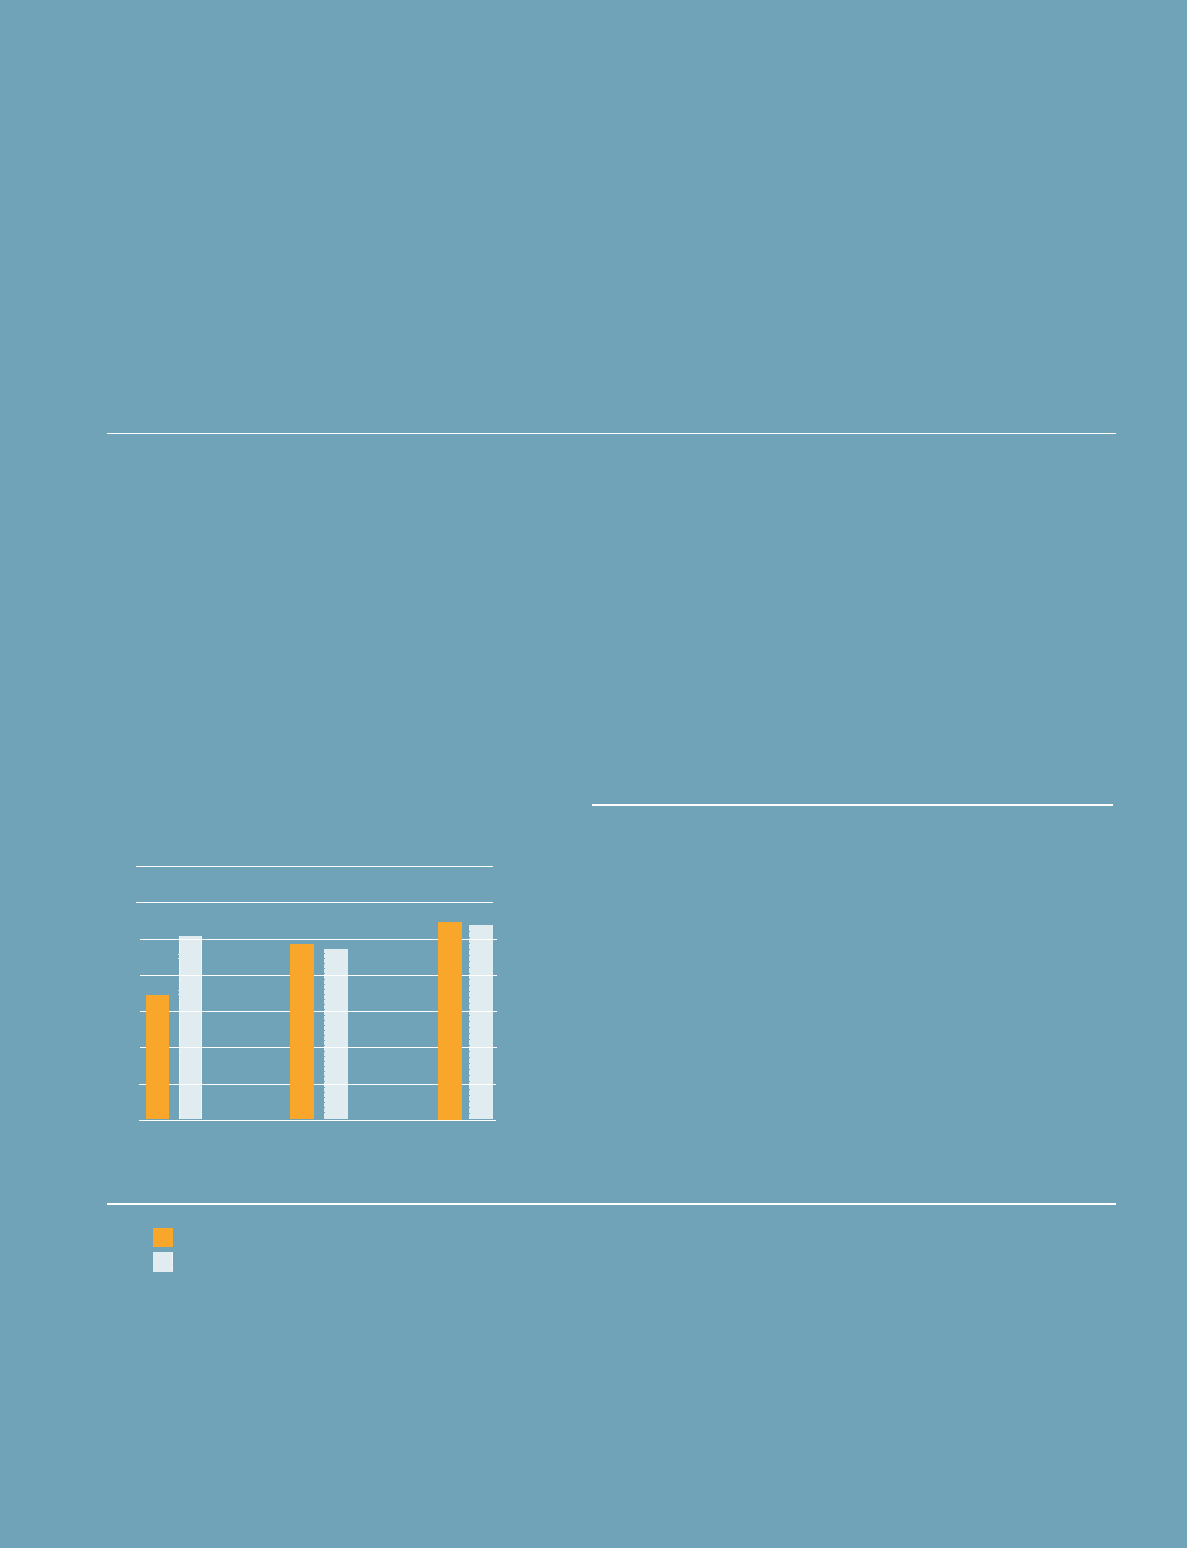
X C E L E N E R G Y E A R N I N G S P E R S H A R E
dollars per share (diluted)
0 4 0 5 0 6
F I N A N C I A L H I G H L I G H T S
2006 2005
Earnings per common share – diluted $ 1.36 $ 1.23
Discontinued operations $ 0.01 $ 0.03
Earnings per common share – diluted
before discontinued operations $ 1.35 $ 1.20
Dividends annualized $ 0.89 $ 0.86
Stock price (close) $ 23.06 $ 18.46
Assets (millions) $ 21,958 $ 21,505
Book value per common share $ 14.28 $ 13.37
Some of the sections in this annual report, including the letter to shareholders
on page 3, contain forward-looking statements. For a discussion of factors
that could affect operating results, please see the management’s discussion
and analysis listed in the table of contents of the Form 10-K.
0 . 8 7 1. 2 3 1. 3 6
1. 2 6 1. 2 0 1. 3 5
total earnings per share
earnings per share from continuing operations