Xcel Energy 2006 Annual Report Download - page 146
Download and view the complete annual report
Please find page 146 of the 2006 Xcel Energy annual report below. You can navigate through the pages in the report by either clicking on the pages listed below, or by using the keyword search tool below to find specific information within the annual report.-
 1
1 -
2
-
3
-
4
-
5
-
6
-
7
-
8
-
9
-
10
-
11
-
12
-
13
-
14
-
15
-
16
-
17
-
18
-
19
-
20
-
21
-
22
-
23
-
24
-
25
-
26
-
27
-
28
-
29
-
30
-
31
-
32
-
33
-
34
-
35
-
36
-
37
-
38
-
39
-
40
-
41
-
42
-
43
-
44
-
45
-
46
-
47
-
48
-
49
-
50
-
51
-
52
-
53
-
54
-
55
-
56
-
57
-
58
-
59
-
60
-
61
-
62
-
63
-
64
-
65
-
66
-
67
-
68
-
69
-
70
-
71
-
72
-
73
-
74
-
75
-
76
-
77
-
78
-
79
-
80
-
81
-
82
-
83
-
84
-
85
-
86
-
87
-
88
-
89
-
90
-
91
-
92
-
93
-
94
-
95
-
96
-
97
-
98
-
99
-
100
-
101
-
102
-
103
-
104
-
105
-
106
-
107
-
108
-
109
-
110
-
111
-
112
-
113
-
114
-
115
-
116
-
117
-
118
-
119
-
120
-
121
-
122
-
123
-
124
-
125
-
126
-
127
-
128
-
129
-
130
-
131
-
132
-
133
-
134
-
135
-
 136
136 -
 137
137 -
 138
138 -
 139
139 -
 140
140 -
 141
141 -
 142
142 -
 143
143 -
 144
144 -
 145
145 -
 146
146 -
 147
147 -
 148
148 -
 149
149 -
 150
150 -
 151
151 -
 152
152 -
 153
153 -
 154
154 -
 155
155 -
 156
156
 |
 |

136
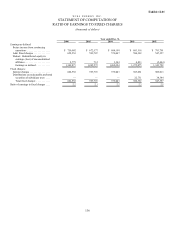
Exhibit 12.01
XCEL ENERGY INC.
STATEMENT OF COMPUTATION OF
RATIO OF EARNINGS TO FIXED CHARGES
(thousands of dollars)
Year ended Dec. 31,
2006 2005 2004 2003 2002
Earnings as defined:
Pretax income from continuing
operations .................. $ 750,092 $ 672,577 $ 684,199 $ 693,516 $ 793,701
Add: Fixed charges............. 622,554 593,707 579,447 586,392 547,357
Deduct: Undistributed equity in
earnings (loss) of unconsolidated
affiliates.................... 2,775 712 3,342 4,833 (2,644)
Earnings as defined........... 1,369,871 1,265,572 1,260,304 1,275,075 1,343,702
Fixed charges:
Interest charges................ 622,554 593,707 579,447 563,661 509,013
Distributions on redeemable preferred
securities of subsidiary trust ....
—
—
—
22,731 38,344
Total fixed charges ........... 622,554 593,707 579,447 586,392 547,357
Ratio of earnings to fixed charges.... 2.2 2.1 2.2 2.2 2.5