Xcel Energy 2006 Annual Report Download - page 54
Download and view the complete annual report
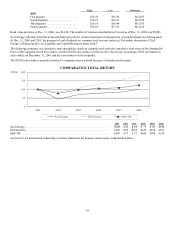
Please find page 54 of the 2006 Xcel Energy annual report below. You can navigate through the pages in the report by either clicking on the pages listed below, or by using the keyword search tool below to find specific information within the annual report.-
 1
1 -
2
-
3
-
4
-
5
-
6
-
7
-
8
-
9
-
10
-
11
-
12
-
13
-
14
-
15
-
16
-
17
-
18
-
19
-
20
-
21
-
22
-
23
-
24
-
25
-
26
-
27
-
28
-
29
-
30
-
31
-
32
-
33
-
34
-
35
-
36
-
37
-
38
-
39
-
40
-
41
-
42
-
43
-
 44
44 -
 45
45 -
 46
46 -
 47
47 -
 48
48 -
 49
49 -
 50
50 -
 51
51 -
 52
52 -
 53
53 -
 54
54 -
 55
55 -
 56
56 -
 57
57 -
 58
58 -
 59
59 -
 60
60 -
 61
61 -
 62
62 -
 63
63 -
 64
64 -
65
-
66
-
67
-
68
-
69
-
70
-
71
-
72
-
73
-
74
-
75
-
76
-
77
-
78
-
79
-
80
-
81
-
82
-
83
-
84
-
85
-
86
-
87
-
88
-
89
-
90
-
91
-
92
-
93
-
94
-
95
-
96
-
97
-
98
-
99
-
100
-
101
-
102
-
103
-
104
-
105
-
106
-
107
-
108
-
109
-
110
-
111
-
112
-
113
-
114
-
115
-
116
-
117
-
118
-
119
-
120
-
121
-
122
-
123
-
124
-
125
-
126
-
127
-
128
-
129
-
130
-
131
-
132
-
133
-
134
-
135
-
136
-
137
-
138
-
139
-
140
-
141
-
142
-
143
-
144
-
145
-
146
-
147
-
148
-
149
-
150
-
151
-
152
-
153
-
154
-
155
-
156
 |
 |

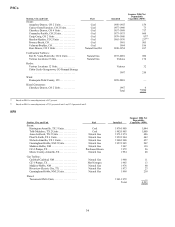
44
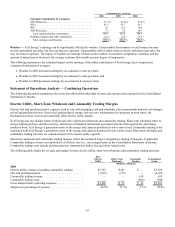
2005
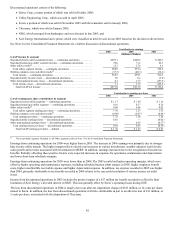
Electric utility revenue (excluding commodity trading) ....... $ 7,038 $ 196 $
—
$ 7,234
Fuel and purchased power............................... (3,802) (120 )
—
(3,922)
Commodity trading revenue..............................
—
—
730 730
Commodity trading costs................................
—
—
(720) (720)
Gross margin before operating expenses ................... $ 3,236 $ 76 $ 10 $ 3,322
Margin as a percentage of revenue ........................ 46.0%38.8 % 1.4%41.7%
2004
Electric utility revenue (excluding commodity trading) ....... $ 5,989 $ 220 $
—
$ 6,209
Fuel and purchased power............................... (2,916) (125 )
—
(3,041)
Commodity trading revenue..............................
—
—
610 610
Commodity trading costs................................
—
—
(594) (594)
Gross margin before operating expenses ................... $ 3,073 $ 95 $ 16 $ 3,184
Margin as a percentage of revenue ........................ 51.3%43.2 % 2.6%46.7%
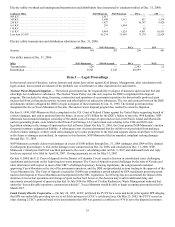
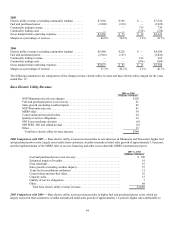
The following summarizes the components of the changes in base electric utility revenue and base electric utility margin for the years
ended Dec. 31:
Base Electric Utility Revenue
2006 vs. 2005
(Millions of Dollars)
NSP-Minnesota electric rate changes ................................... $129
Fuel and purchased power cost recovery................................. 61
Sales growth (excluding weather impact)................................ 45
NSP-Wisconsin rate case............................................. 41
MERP rider........................................................ 38
Conservation and non-fuel riders....................................... 24
Quality of service obligations.......................................... 12
SPS Texas surcharge decision ......................................... (8)
SPS FERC 206 rate refund accrual ..................................... (8)
Other.............................................................. 15
Total base electric utility revenue increase ............................. $349
2006 Comparison with 2005 — Base electric utility revenues increased due to rate increases in Minnesota and Wisconsin, higher fuel
and purchased power costs, largely recoverable from customers, weather-normalized retail sales growth of approximately 1.8 percent,
and the implementation of the MERP rider to recover financing and other costs related the MERP construction projects.
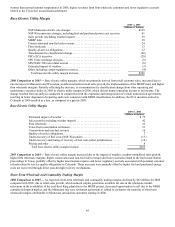
2005 vs. 2004
(Millions of Dollars)
Fuel and purchased power cost recovery ................................ $ 706
Estimated impact of weather.......................................... 91
Firm wholesale..................................................... 67
Sales growth (excluding weather impact)................................ 57
Texas fuel reconciliation settlement .................................... 21
Conservation and non-fuel riders ...................................... 16
Capacity sales...................................................... 15
Quality of service obligations ......................................... 7
Other............................................................. 69
Total base electric utility revenue increase ............................. $1,049
2005 Comparison with 2004 — Base electric utility revenues increased due to higher fuel and purchased power costs, which are
largely recovered from customers; weather-normalized retail sales growth of approximately 1.4 percent; higher sales attributable to