Xcel Energy 2006 Annual Report Download - page 87
Download and view the complete annual report
Please find page 87 of the 2006 Xcel Energy annual report below. You can navigate through the pages in the report by either clicking on the pages listed below, or by using the keyword search tool below to find specific information within the annual report.-
 1
1 -
2
-
3
-
4
-
5
-
6
-
7
-
8
-
9
-
10
-
11
-
12
-
13
-
14
-
15
-
16
-
17
-
18
-
19
-
20
-
21
-
22
-
23
-
24
-
25
-
26
-
27
-
28
-
29
-
30
-
31
-
32
-
33
-
34
-
35
-
36
-
37
-
38
-
39
-
40
-
41
-
42
-
43
-
44
-
45
-
46
-
47
-
48
-
49
-
50
-
51
-
52
-
53
-
54
-
55
-
56
-
57
-
58
-
59
-
60
-
61
-
62
-
63
-
64
-
65
-
66
-
67
-
68
-
69
-
70
-
71
-
72
-
73
-
74
-
75
-
76
-
 77
77 -
 78
78 -
 79
79 -
 80
80 -
 81
81 -
 82
82 -
 83
83 -
 84
84 -
 85
85 -
 86
86 -
 87
87 -
 88
88 -
 89
89 -
 90
90 -
 91
91 -
 92
92 -
 93
93 -
 94
94 -
 95
95 -
 96
96 -
 97
97 -
98
-
99
-
100
-
101
-
102
-
103
-
104
-
105
-
106
-
107
-
108
-
109
-
110
-
111
-
112
-
113
-
114
-
115
-
116
-
117
-
118
-
119
-
120
-
121
-
122
-
123
-
124
-
125
-
126
-
127
-
128
-
129
-
130
-
131
-
132
-
133
-
134
-
135
-
136
-
137
-
138
-
139
-
140
-
141
-
142
-
143
-
144
-
145
-
146
-
147
-
148
-
149
-
150
-
151
-
152
-
153
-
154
-
155
-
156
 |
 |

77
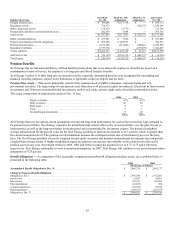
Nonregulated Subsidiaries
Utility Engineering — In April 2005, Zachry acquired all of the outstanding shares of UE. Xcel Energy recorded an insignificant loss
in the first quarter of 2005 as a result of the transaction. The majority of Quixx Corp., including Borger Energy Associates and Quixx
Power Services, Inc., was sold in October 2006 to affiliates of Energy Investors Funds.
Seren — In November 2005, Xcel Energy sold Seren’s California assets to WaveDivision Holdings, LLC. In January 2006, Xcel
Energy sold Seren’s Minnesota assets to Charter Communications. An estimated after-tax impairment charge, including disposition
costs, of $143 million, or 34 cents per share, was recorded in 2004. Based on the sales agreements entered into in 2005, the estimate
was adjusted in 2005 to reflect a total asset impairment of $140 million.
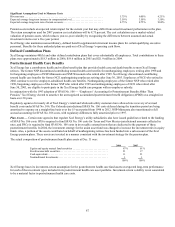
Xcel Energy International and e prime — The exit of all business conducted by e prime was completed in 2004. The results of
discontinued nonregulated operations in 2004 include the impact of the sale of the Argentina subsidiaries of Xcel Energy
International, for a sales price of approximately $31 million. In addition to the sales price, Xcel Energy also received approximately
$21 million at the closing of one transaction as redemption of its capital investment. The sales resulted in a gain of approximately $8
million, including the realization of approximately $7 million of income tax benefits realizable upon the sale of the Xcel Energy
International assets.
NRG — With NRG’s emergence from bankruptcy in December 2003, Xcel Energy divested its ownership interest in NRG. Xcel
Energy recognized $13 million tax expense and $17 million tax benefit related to the divestiture of NRG in 2004 and 2005,
respectively. These tax expenses and benefits are reported as discontinued operations.
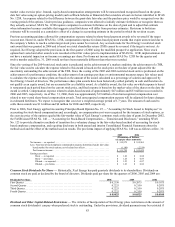
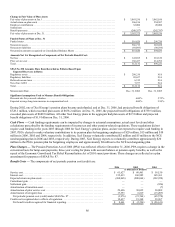
Summarized Financial Results of Discontinued Operations
Utility Segment
All Other
Segment Total
(Thousands of Dollars)
2006
Operating revenue..................................................... $
—
$ 7,525 $ 7,525
Operating and other expenses ........................................... 278 9,011 9,289
Pretax loss from operations of discontinued components ................... (278 ) (1,486) (1,764)
Income tax benefit .................................................... (3,291 ) (1,546) (4,837)
Income from operations of discontinued components ...................... 3,013 60 3,073
Net income from discontinued operations.............................. $ 3,013 $ 60 $ 3,073
2005
Operating revenue..................................................... $ 6,579 $ 63,206 $ 69,785
Operating and other expenses ........................................... 6,131 68,669 74,800
Pretax income (loss) from operations of discontinued components ........... 448 (5,463) (5,015)
Income tax expense (benefit)............................................ 268 (19,217) (18,949)
Income from operations of discontinued components ...................... 180 13,754 13,934
Net income from discontinued operations.............................. $ 180 $ 13,754 $ 13,934
2004
Operating revenue..................................................... $72,232 $179,890 $252,122
Operating and other expenses ........................................... 68,305 194,605 262,910
Special charges and impairments......................................... 6,574 228,439 235,013
Pretax loss from operations of discontinued components ................... (2,647 ) (243,154) (245,801)
Income tax expense (benefit)............................................ 6,388 (78,021) (71,633)
Loss from operations of discontinued components ........................ (9,035 ) (165,133) (174,168)
Estimated pretax gain on disposal of discontinued components ................
—
961 961
Income tax benefit ....................................................
—
6,904 6,904
Gain on disposal of discontinued components..............................
—
7,865 7,865
Net loss from discontinued operations................................. $(9,035 ) $(157,268) $(166,303)