Xcel Energy 2006 Annual Report Download - page 49
Download and view the complete annual report
Please find page 49 of the 2006 Xcel Energy annual report below. You can navigate through the pages in the report by either clicking on the pages listed below, or by using the keyword search tool below to find specific information within the annual report.-
 1
1 -
2
-
3
-
4
-
5
-
6
-
7
-
8
-
9
-
10
-
11
-
12
-
13
-
14
-
15
-
16
-
17
-
18
-
19
-
20
-
21
-
22
-
23
-
24
-
25
-
26
-
27
-
28
-
29
-
30
-
31
-
32
-
33
-
34
-
35
-
36
-
37
-
38
-
 39
39 -
 40
40 -
 41
41 -
 42
42 -
 43
43 -
 44
44 -
 45
45 -
 46
46 -
 47
47 -
 48
48 -
 49
49 -
 50
50 -
 51
51 -
 52
52 -
 53
53 -
 54
54 -
 55
55 -
 56
56 -
 57
57 -
 58
58 -
 59
59 -
60
-
61
-
62
-
63
-
64
-
65
-
66
-
67
-
68
-
69
-
70
-
71
-
72
-
73
-
74
-
75
-
76
-
77
-
78
-
79
-
80
-
81
-
82
-
83
-
84
-
85
-
86
-
87
-
88
-
89
-
90
-
91
-
92
-
93
-
94
-
95
-
96
-
97
-
98
-
99
-
100
-
101
-
102
-
103
-
104
-
105
-
106
-
107
-
108
-
109
-
110
-
111
-
112
-
113
-
114
-
115
-
116
-
117
-
118
-
119
-
120
-
121
-
122
-
123
-
124
-
125
-
126
-
127
-
128
-
129
-
130
-
131
-
132
-
133
-
134
-
135
-
136
-
137
-
138
-
139
-
140
-
141
-
142
-
143
-
144
-
145
-
146
-
147
-
148
-
149
-
150
-
151
-
152
-
153
-
154
-
155
-
156
 |
 |

39
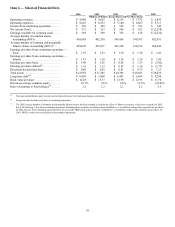
Item 6 — Selected Financial Data
2006 2005 2004 2003 2002
(Millions of Dollars, Except Share and Per-Share Data)
Operating revenues.................... $ 9,840 $ 9,625 $ 8,216 $ 7,731 $ 6,893
Operating expenses.................... $ 8,663 $ 8,533 $ 7,140 $ 6,607 $ 5,717
Income from continuing operations....... $ 569 $ 499 $ 522 $ 523 $ 549
Net income (loss)..................... $ 572 $ 513 $ 356 $ 622 $ (2,218)
Earnings available for common stock..... $ 568 $ 509 $ 352 $ 618 $ (2,222)
Average number of common shares
outstanding (000’s).................. 405,689 402,330 399,456 398,765 382,051
Average number of common and potentially
dilutive shares outstanding (000’s)(c).... 429,605 425,671 423,334 418,912 384,646
Earnings per share from continuing operations —
basic.............................. $ 1.39 $ 1.23 $ 1.30 $ 1.30 $ 1.43
Earnings per share from continuing operations —
diluted ............................ $ 1.35 $ 1.20 $ 1.26 $ 1.26 $ 1.43
Earnings per share-basic................ $ 1.40 $ 1.26 $ 0.88 $ 1.55 $ (5.82)
Earnings per share-diluted(c) ............ $ 1.36 $ 1.23 $ 0.87 $ 1.50 $ (5.77)
Dividends declared per share............ $ 0.88 $ 0.85 $ 0.81 $ 0.75 $ 1.13
Total assets.......................... $ 21,958 $ 21,505 $ 20,305 $ 20,205 $ 29,436
Long-term debt(b) ..................... $ 6,450 $ 5,898 $ 6,493 $ 6,494 $ 5,294
Book value per share .................. $ 14.28 $ 13.37 $ 12.99 $ 12.95 $ 11.70
Return on average common equity....... 10.1% 9.6% 6.8% 12.6% (41.0)%
Ratio of earnings to fixed charges(a) ...... 2.2 2.2 2.2 2.2 2.5
(a) Excludes undistributed equity income and includes allowance for funds used during construction.
(b) Long-term debt includes only debt of continuing operations.
(c) The 2002 average number of common and potentially dilutive shares has been restated to include the effect of dilutive securities, which were excluded in 2002
due to Xcel Energy’s loss from continuing operations. Including these securities would have been antidilutive, or would have reduced the reported loss per share.
In 2002, the loss from continuing operations that was caused by NRG made some securities “antidilutive” or would have reduced the reported loss per share. In
2003, NRG’s results were reclassified to discontinued operations.