Xcel Energy 2006 Annual Report Download - page 53
Download and view the complete annual report
Please find page 53 of the 2006 Xcel Energy annual report below. You can navigate through the pages in the report by either clicking on the pages listed below, or by using the keyword search tool below to find specific information within the annual report.-
 1
1 -
2
-
3
-
4
-
5
-
6
-
7
-
8
-
9
-
10
-
11
-
12
-
13
-
14
-
15
-
16
-
17
-
18
-
19
-
20
-
21
-
22
-
23
-
24
-
25
-
26
-
27
-
28
-
29
-
30
-
31
-
32
-
33
-
34
-
35
-
36
-
37
-
38
-
39
-
40
-
41
-
42
-
 43
43 -
 44
44 -
 45
45 -
 46
46 -
 47
47 -
 48
48 -
 49
49 -
 50
50 -
 51
51 -
 52
52 -
 53
53 -
 54
54 -
 55
55 -
 56
56 -
 57
57 -
 58
58 -
 59
59 -
 60
60 -
 61
61 -
 62
62 -
 63
63 -
64
-
65
-
66
-
67
-
68
-
69
-
70
-
71
-
72
-
73
-
74
-
75
-
76
-
77
-
78
-
79
-
80
-
81
-
82
-
83
-
84
-
85
-
86
-
87
-
88
-
89
-
90
-
91
-
92
-
93
-
94
-
95
-
96
-
97
-
98
-
99
-
100
-
101
-
102
-
103
-
104
-
105
-
106
-
107
-
108
-
109
-
110
-
111
-
112
-
113
-
114
-
115
-
116
-
117
-
118
-
119
-
120
-
121
-
122
-
123
-
124
-
125
-
126
-
127
-
128
-
129
-
130
-
131
-
132
-
133
-
134
-
135
-
136
-
137
-
138
-
139
-
140
-
141
-
142
-
143
-
144
-
145
-
146
-
147
-
148
-
149
-
150
-
151
-
152
-
153
-
154
-
155
-
156
 |
 |

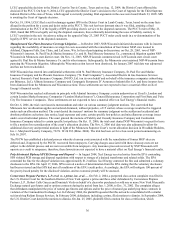
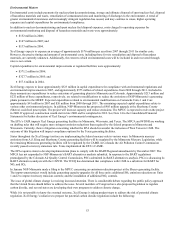
43
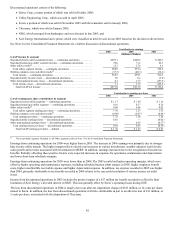
Contribution to earnings
2006 2005 2004
Earnings Contribution by Company
NSP-Minnesota.................................. 47.4%46.6% 43.0%
PSCo.......................................... 41.5 41.7 41.3
SPS........................................... 8.1 12.5 10.3
NSP-Wisconsin.................................. 7.4 5.0 10.3
Total regulated utility contribution................. 104.4 105.8 104.9
Holding company and other subsidiaries .............. (4.4) (5.8) (4.9)
Total earnings contributions...................... 100.0%100.0% 100.0%
Weather — Xcel Energy’s earnings can be significantly affected by weather. Unseasonably hot summers or cold winters increase
electric and natural gas sales, but also can increase expenses. Unseasonably mild weather reduces electric and natural gas sales, but
may not reduce expenses. The impact of weather on earnings is based on the number of customers, temperature variances and the
amount of natural gas or electricity the average customer historically uses per degree of temperature.
The following summarizes the estimated impact on the earnings of the utility subsidiaries of Xcel Energy due to temperature
variations from historical averages:
• Weather in 2006 increased earnings by an estimated 2 cents per share;
• Weather in 2005 increased earnings by an estimated 3 cents per share; and
• Weather in 2004 decreased earnings by an estimated 8 cents per share.
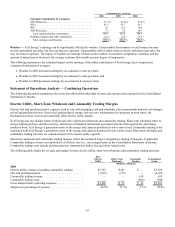
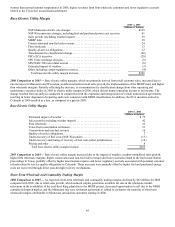
Statement of Operations Analysis — Continuing Operations
The following discussion summarizes the items that affected the individual revenue and expense items reported in the Consolidated
Statements of Income.
Electric Utility, Short-Term Wholesale and Commodity Trading Margins
Electric fuel and purchased power expenses tend to vary with changing retail and wholesale sales requirements and unit cost changes
in fuel and purchased power. Due to fuel and purchased energy cost-recovery mechanisms for customers in most states, the
fluctuations in these costs do not materially affect electric utility margin.
Xcel Energy has two distinct forms of wholesale sales: short-term wholesale and commodity trading. Short-term wholesale refers to
energy-related purchase and sales activity, and the use of financial instruments associated with the fuel required for, and energy
produced from, Xcel Energy’s generation assets or the energy and capacity purchased to serve native load. Commodity trading is not
associated with Xcel Energy’s generation assets or the energy and capacity purchased to serve native load. Short-term wholesale and
commodity trading activities are considered part of the electric utility segment.
Short-term wholesale and commodity trading margins reflect the estimated impact of regulatory sharing of margins, if applicable.
Commodity trading revenues are reported net of related costs (i.e., on a margin basis) in the Consolidated Statements of Income.
Commodity trading costs include purchased power, transmission, broker fees and other related costs.
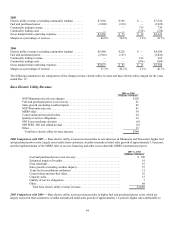
The following table details the revenue and margin for base electric utility, short-term wholesale and commodity trading activities:
Base
Electric
Utility
Short-Term
Wholesale
Commodity
Trading
Consolidated
Totals
(Millions of Dollars)
2006
Electric utility revenue (excluding commodity trading) ....... $ 7,387 $ 201 $
—
$ 7,588
Fuel and purchased power............................... (3,925) (178 )
—
(4,103)
Commodity trading revenue..............................
—
—
610 610
Commodity trading costs................................
—
—
(590) (590)
Gross margin before operating expenses ................... $ 3,462 $ 23 $ 20 $ 3,505
Margin as a percentage of revenue ........................ 46.9%11.4 % 3.3%42.8%