Xcel Energy 2006 Annual Report Download - page 135
Download and view the complete annual report
Please find page 135 of the 2006 Xcel Energy annual report below. You can navigate through the pages in the report by either clicking on the pages listed below, or by using the keyword search tool below to find specific information within the annual report.-
 1
1 -
2
-
3
-
4
-
5
-
6
-
7
-
8
-
9
-
10
-
11
-
12
-
13
-
14
-
15
-
16
-
17
-
18
-
19
-
20
-
21
-
22
-
23
-
24
-
25
-
26
-
27
-
28
-
29
-
30
-
31
-
32
-
33
-
34
-
35
-
36
-
37
-
38
-
39
-
40
-
41
-
42
-
43
-
44
-
45
-
46
-
47
-
48
-
49
-
50
-
51
-
52
-
53
-
54
-
55
-
56
-
57
-
58
-
59
-
60
-
61
-
62
-
63
-
64
-
65
-
66
-
67
-
68
-
69
-
70
-
71
-
72
-
73
-
74
-
75
-
76
-
77
-
78
-
79
-
80
-
81
-
82
-
83
-
84
-
85
-
86
-
87
-
88
-
89
-
90
-
91
-
92
-
93
-
94
-
95
-
96
-
97
-
98
-
99
-
100
-
101
-
102
-
103
-
104
-
105
-
106
-
107
-
108
-
109
-
110
-
111
-
112
-
113
-
114
-
115
-
116
-
117
-
118
-
119
-
120
-
121
-
122
-
123
-
124
-
 125
125 -
 126
126 -
 127
127 -
 128
128 -
 129
129 -
 130
130 -
 131
131 -
 132
132 -
 133
133 -
 134
134 -
 135
135 -
 136
136 -
 137
137 -
 138
138 -
 139
139 -
 140
140 -
 141
141 -
 142
142 -
 143
143 -
 144
144 -
 145
145 -
146
-
147
-
148
-
149
-
150
-
151
-
152
-
153
-
154
-
155
-
156
 |
 |

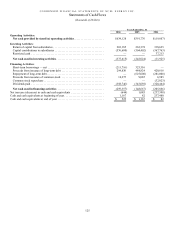
125
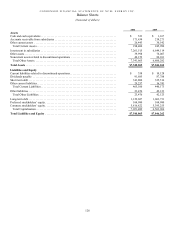
CONDENSED FINANCIAL STATEMENTS OF XCEL ENERGY INC.
Statements of Cash Flows
(thousands of Dollars)
Years Ended Dec. 31
2006 2005 2004
Operating Activities:
Net cash provided by (used in) operating activities...................... $634,128 $391,776 $ (19,607)
Investing Activities:
Return of capital from subsidiaries ..................................... 201,185 262,378 318,625
Capital contributions to subsidiaries.................................... (576,600 ) (504,402) (367,763)
Restricted cash .....................................................
—
—
37,213
Net cash used in investing activities ................................... (375,415 ) (242,024) (11,925)
Financing Activities:
Short-term borrowings — net ......................................... (211,716 ) 325,516
—
Proceeds from issuance of long-term debt ............................... 294,830 484,824 420,616
Repayment of long-term debt..........................................
—
( 625 ,0 00) (281,000)
Proceeds from issuance of common stock ............................... 16,275 9,085 6,985
Common stock repurchase............................................
—
—
(32,023)
Dividends paid ..................................................... (358,746 ) (343,092) (320,444)
Net cash used in financing activities .................................. (259,357 ) (148,667) (205,866)
Net increase (decrease) in cash and cash equivalents ........................ (644 ) 1,085 (237,398)
Cash and cash equivalents at beginning of year............................. 1,167 82 237,480
Cash and cash equivalents at end of year.................................. $ 523 $ 1,167 $ 82