Xcel Energy 2006 Annual Report Download - page 96
Download and view the complete annual report
Please find page 96 of the 2006 Xcel Energy annual report below. You can navigate through the pages in the report by either clicking on the pages listed below, or by using the keyword search tool below to find specific information within the annual report.-
 1
1 -
2
-
3
-
4
-
5
-
6
-
7
-
8
-
9
-
10
-
11
-
12
-
13
-
14
-
15
-
16
-
17
-
18
-
19
-
20
-
21
-
22
-
23
-
24
-
25
-
26
-
27
-
28
-
29
-
30
-
31
-
32
-
33
-
34
-
35
-
36
-
37
-
38
-
39
-
40
-
41
-
42
-
43
-
44
-
45
-
46
-
47
-
48
-
49
-
50
-
51
-
52
-
53
-
54
-
55
-
56
-
57
-
58
-
59
-
60
-
61
-
62
-
63
-
64
-
65
-
66
-
67
-
68
-
69
-
70
-
71
-
72
-
73
-
74
-
75
-
76
-
77
-
78
-
79
-
80
-
81
-
82
-
83
-
84
-
85
-
 86
86 -
 87
87 -
 88
88 -
 89
89 -
 90
90 -
 91
91 -
 92
92 -
 93
93 -
 94
94 -
 95
95 -
 96
96 -
 97
97 -
 98
98 -
 99
99 -
 100
100 -
 101
101 -
 102
102 -
 103
103 -
 104
104 -
 105
105 -
 106
106 -
107
-
108
-
109
-
110
-
111
-
112
-
113
-
114
-
115
-
116
-
117
-
118
-
119
-
120
-
121
-
122
-
123
-
124
-
125
-
126
-
127
-
128
-
129
-
130
-
131
-
132
-
133
-
134
-
135
-
136
-
137
-
138
-
139
-
140
-
141
-
142
-
143
-
144
-
145
-
146
-
147
-
148
-
149
-
150
-
151
-
152
-
153
-
154
-
155
-
156
 |
 |

86
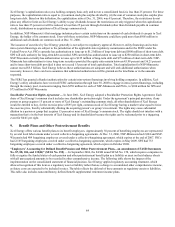
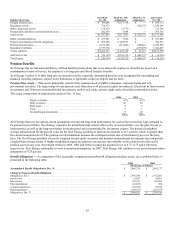
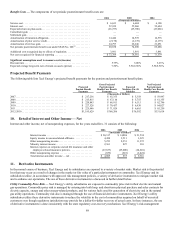
Change in Fair Value of Plan Assets
Fair value of plan assets at Jan. 1......................................................... $ 3,093,536 $ 3,062,016
Actual return on plan assets............................................................. 306,196 254,307
Employer contributions ................................................................ 32,000 20,000
Settlements .........................................................................
—
Benefit payments..................................................................... (248,357) (242,787)
Fair value of plan assets at Dec. 31........................................................ $ 3,183,375 $ 3,093,536
Funded Status of Plans at Dec. 31
Funded status ........................................................................ $ 516,820 $ 296,756
Noncurrent assets..................................................................... 586,713 685,028
Noncurrent liabilities.................................................................. (69,893) (90,595)
Net pension amounts recognized on Consolidated Balance Sheets ................................ $ 516,820 $ 594,433
Amounts Not Yet Recognized as Components of Net Periodic Benefit Cost:
Net loss............................................................................ $ 143,695 $ 281,519
Prior service cost..................................................................... 168,437 214,702
Total .............................................................................. $ 312,132 $ 496,221
SFAS No.158 Amounts Have Been Recorded as Follows Based Upon
Expected Recovery in Rates:
Regulatory assets..................................................................... $ 208,216 N/A
Regulatory liabilities .................................................................. 89,627 N/A
Deferred income taxes................................................................. 6,312 N/A
Net-of-tax AOCI ..................................................................... 7,977 N/A
Total .............................................................................. $ 312,132 N/A
Measurement Date.................................................................... Dec. 31, 2006 Dec. 31, 2005
Significant Assumptions Used to Measure Benefit Obligations
Discount rate for year-end valuation....................................................... 6.00% 5.75%
Expected average long-term increase in compensation level..................................... 4.00% 3.50%
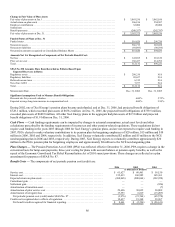
During 2002, one of Xcel Energy’s pension plans became underfunded, and at Dec. 31, 2006, had projected benefit obligations of
$728.1 million, which exceeded plan assets of $658.2 million. At Dec. 31, 2005, the projected benefit obligations of $739.5 million,
exceeded plan assets of $609.8 million. All other Xcel Energy plans in the aggregate had plan assets of $2.5 billion and projected
benefit obligations of $1.9 billion on Dec. 31, 2006.
Cash Flows — Cash funding requirements can be impacted by changes to actuarial assumptions, actual asset levels and other
calculations prescribed by the funding requirements of income tax and other pension-related regulations. These regulations did not
require cash funding in the years 2003 through 2006 for Xcel Energy’s pension plans, and are not expected to require cash funding in
2007. PSCo elected to make voluntary contributions to its pension plan for bargaining employees of $29 million, $15 million and $10
million in 2006, 2005 and 2004, respectively. In addition, Xcel Energy voluntarily contributed $2 million and $5 million to the NCE
non-bargaining plan in 2006 and 2005, respectively. During 2007, Xcel Energy expects to voluntarily contribute approximately $20
million to the PSCo pension plan for bargaining employees and approximately $8 million to the NCE non-bargaining plan.
Plan Changes — The Pension Protection Act of 2006 (PPA) was reflected effective December 31, 2006. PPA requires a change in the
conversion basis for lump-sum payments, three-year vesting for plans with account balance or pension equity benefits, as well as the
repeal of the Economic Growth and Tax Relief Reconciliation Act of 2001 sunset provisions. These changes are reflected as a plan
amendment for purposes of SFAS No. 87.
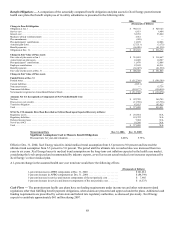
Benefit Costs — The components of net periodic pension cost (credit) are:
2006 2005 2004
(Thousands of Dollars)
Service cost............................................................. $ 61,627 $ 60,461 $ 58,150
Interest cost............................................................. 155,413 160,985 165,361
Expected return on plan assets............................................... (268,065 ) (280,064 ) (302,958 )
Curtailment gain ......................................................... —
—
—
Settlement gain .......................................................... —
—
(926)
Amortization of transition asset.............................................. —
—
(7)
Amortization of prior service cost............................................ 29,696 30,035 30,009
Amortization of net (gain) loss .............................................. 17,353 6,819 (15,207)
Net periodic pension cost (credit) under SFAS No. 87 .......................... (3,976 ) (21,764 ) (65,578 )
Credits not recognized due to effects of regulation............................... 12,637 19,368 38,967
Net benefit credit recognized for financial reporting ............................ $ 8,661 $ (2,396) $ (26,611)