Xcel Energy 2006 Annual Report Download - page 95
Download and view the complete annual report
Please find page 95 of the 2006 Xcel Energy annual report below. You can navigate through the pages in the report by either clicking on the pages listed below, or by using the keyword search tool below to find specific information within the annual report.-
 1
1 -
2
-
3
-
4
-
5
-
6
-
7
-
8
-
9
-
10
-
11
-
12
-
13
-
14
-
15
-
16
-
17
-
18
-
19
-
20
-
21
-
22
-
23
-
24
-
25
-
26
-
27
-
28
-
29
-
30
-
31
-
32
-
33
-
34
-
35
-
36
-
37
-
38
-
39
-
40
-
41
-
42
-
43
-
44
-
45
-
46
-
47
-
48
-
49
-
50
-
51
-
52
-
53
-
54
-
55
-
56
-
57
-
58
-
59
-
60
-
61
-
62
-
63
-
64
-
65
-
66
-
67
-
68
-
69
-
70
-
71
-
72
-
73
-
74
-
75
-
76
-
77
-
78
-
79
-
80
-
81
-
82
-
83
-
84
-
 85
85 -
 86
86 -
 87
87 -
 88
88 -
 89
89 -
 90
90 -
 91
91 -
 92
92 -
 93
93 -
 94
94 -
 95
95 -
 96
96 -
 97
97 -
 98
98 -
 99
99 -
 100
100 -
 101
101 -
 102
102 -
 103
103 -
 104
104 -
 105
105 -
106
-
107
-
108
-
109
-
110
-
111
-
112
-
113
-
114
-
115
-
116
-
117
-
118
-
119
-
120
-
121
-
122
-
123
-
124
-
125
-
126
-
127
-
128
-
129
-
130
-
131
-
132
-
133
-
134
-
135
-
136
-
137
-
138
-
139
-
140
-
141
-
142
-
143
-
144
-
145
-
146
-
147
-
148
-
149
-
150
-
151
-
152
-
153
-
154
-
155
-
156
 |
 |

85
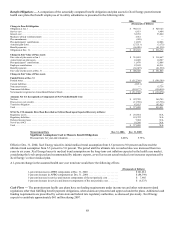
Balance Sheet Line
Pre-SFAS
No. 158
SFAS No. 158
Adjustment
SFAS No. 71
Adjustment
After SFAS
No. 158
Prepaid pension asset........................................... $ 704,046 $ (117,334 ) $ — $ 586,712
Regulatory assets.............................................. 736,673 — 452,472 1,189,145
Other (long-term assets) ........................................ 138,519 (2,773 ) — 135,746
Prepayments and other (current deferred taxes)....................... 202,659 3,084 — 205,743
Total Assets.................................................. $ 1,781,897 $ (117,023 ) $ 452,472 $ 2,117,346
Other (current liabilities)........................................ $ 339,951 $ 7,858 $ — $ 347,809
Pension and employee benefit obligations........................... $ 282,380 $ 422,533 $ — 704,913
Deferred income taxes.......................................... 2,211,250 (211,061 ) 256,410 2,256,599
Regulatory liabilities ........................................... 1,577,752 — (213,095) 1,364,657
Total Liabilities............................................... $ 4,411,333 $ 219,330 $ 43,315 $ 4,673,978
AOCI-net of tax............................................... $ (89,130) $ (336,353 ) $ 409,157 $ (16,326 )
Total Equity.................................................. $ (89,130) $ (336,353 ) $ 409,157 $ (16,326 )
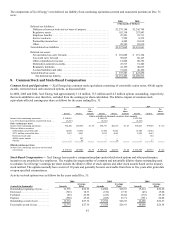
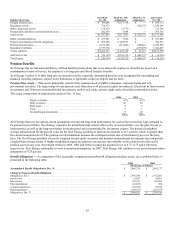
Pension Benefits
Xcel Energy has several noncontributory, defined benefit pension plans that cover almost all employees. Benefits are based on a
combination of years of service, the employee’s average pay and Social Security benefits.
Xcel Energy’s policy is to fully fund into an external trust the actuarially determined pension costs recognized for ratemaking and
financial reporting purposes, subject to the limitations of applicable employee benefit and tax laws.
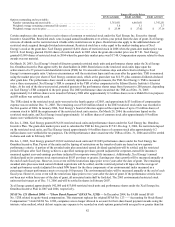
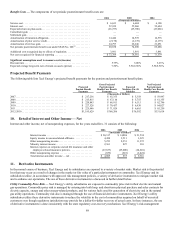
Pension Plan Assets — Plan assets principally consist of the common stock of public companies, corporate bonds and U.S.
government securities. The target range for our pension asset allocation is 60 percent in equity investments, 20 percent in fixed income
investments and 20 percent in nontraditional investments, such as real estate, private equity and a diversified commodities index.
The actual composition of pension plan assets at Dec. 31 was:
2006 2005
Equity securities .............................................. 63% 65%
Debt securities................................................ 22 20
Real estate................................................... 4 4
Cash........................................................ 2 1
Nontraditional investments ...................................... 9 10
100% 100%
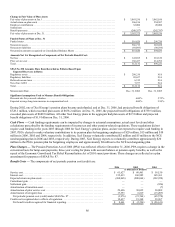
Xcel Energy bases its investment-return assumption on expected long-term performance for each of the investment types included in
its pension asset portfolio. Xcel Energy considers the actual historical returns achieved by its asset portfolio over the past 20-year or
longer period, as well as the long-term return levels projected and recommended by investment experts. The historical weighted
average annual return for the past 20 years for the Xcel Energy portfolio of pension investments is 11.3 percent, which is greater than
the current assumption level. The pension cost determination assumes the continued current mix of investment types over the long
term. The Xcel Energy portfolio is heavily weighted toward equity securities and includes nontraditional investments that can provide
a higher-than-average return. A higher weighting in equity investments can increase the volatility in the return levels achieved by
pension assets in any year. Investment returns in 2006, 2005 and 2004 exceeded the assumed level of 8.75, 8.75 and 9.0 percent,
respectively. Xcel Energy continually reviews its pension assumptions. In 2007, Xcel Energy will continue to use an investment-return
assumption of 8.75 percent.
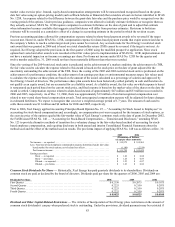
Benefit Obligations — A comparison of the actuarially computed pension-benefit obligation and plan assets, on a combined basis, is
presented in the following table:
2006 2005
(Thousands of Dollars)
Accumulated Benefit Obligation at Dec. 31................................................ $ 2,486,370 $ 2,642,177
Change in Projected Benefit Obligation
Obligation at Jan. 1 ................................................................... $ 2,796,780 $ 2,732,263
Service cost......................................................................... 61,627 60,461
Interest cost......................................................................... 155,413 160,985
Plan amendments..................................................................... (16,569) 300
Actuarial (gain) loss................................................................... (82,339) 85,558
Benefit payments..................................................................... (248,357) (242,787)
Obligation at Dec. 31.................................................................. $ 2,666,555 $ 2,796,780