Xcel Energy 2006 Annual Report Download - page 116
Download and view the complete annual report
Please find page 116 of the 2006 Xcel Energy annual report below. You can navigate through the pages in the report by either clicking on the pages listed below, or by using the keyword search tool below to find specific information within the annual report.-
 1
1 -
2
-
3
-
4
-
5
-
6
-
7
-
8
-
9
-
10
-
11
-
12
-
13
-
14
-
15
-
16
-
17
-
18
-
19
-
20
-
21
-
22
-
23
-
24
-
25
-
26
-
27
-
28
-
29
-
30
-
31
-
32
-
33
-
34
-
35
-
36
-
37
-
38
-
39
-
40
-
41
-
42
-
43
-
44
-
45
-
46
-
47
-
48
-
49
-
50
-
51
-
52
-
53
-
54
-
55
-
56
-
57
-
58
-
59
-
60
-
61
-
62
-
63
-
64
-
65
-
66
-
67
-
68
-
69
-
70
-
71
-
72
-
73
-
74
-
75
-
76
-
77
-
78
-
79
-
80
-
81
-
82
-
83
-
84
-
85
-
86
-
87
-
88
-
89
-
90
-
91
-
92
-
93
-
94
-
95
-
96
-
97
-
98
-
99
-
100
-
101
-
102
-
103
-
104
-
105
-
 106
106 -
 107
107 -
 108
108 -
 109
109 -
 110
110 -
 111
111 -
 112
112 -
 113
113 -
 114
114 -
 115
115 -
 116
116 -
 117
117 -
 118
118 -
 119
119 -
 120
120 -
 121
121 -
 122
122 -
 123
123 -
 124
124 -
 125
125 -
 126
126 -
127
-
128
-
129
-
130
-
131
-
132
-
133
-
134
-
135
-
136
-
137
-
138
-
139
-
140
-
141
-
142
-
143
-
144
-
145
-
146
-
147
-
148
-
149
-
150
-
151
-
152
-
153
-
154
-
155
-
156
 |
 |

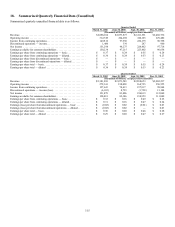
106
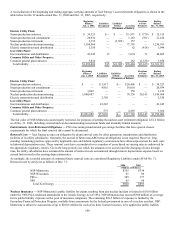
A reconciliation of the beginning and ending aggregate carrying amounts of Xcel Energy’s asset retirement obligations is shown in the
table below for the 12 months ended Dec. 31, 2006 and Dec. 31, 2005, respectively:
Beginning
Balance
Jan. 1, 2006
Liabilities
Recognized
Liabilities
Settled Accretion
Revisions
to Prior
Estimates
Ending
Balance
Dec. 31, 2006
(Thousands of Dollars)
Electric Utility Plant:
Steam production asbestos......................... $ 34,323 $
—
$
—
$ 1,971 $ (779) $ 35,515
Steam production ash containment.................. 20,934
—
—
1,183 (701) 21,416
Steam production retirement....................... 3,152
—
(3,309) 157
—
—
Nuclear production decommissioning................ 1,184,968
—
—
71,795
—
1,256,763
Electric transmission and distribution................ 2,350
—
—
62 (418) 1,994
Gas Utility Plant:
Gas transmission and distribution................... 43,245 15
—
1,074 71 44,405
Common Utility and Other Property:
Common general plant asbestos .................... 3,034
—
—
162 (1,338) 1,858
Total liability .................................. $1,292,006 $15 $(3,309) $76,404 $(3,165) $1,361,951
Beginning
Balance
Jan. 1, 2005
Liabilities
Recognized
Liabilities
Settled Accretion
Revisions
to Prior
Estimates
Ending
Balance
Dec. 31, 2005
(Thousands of Dollars)
Electric Utility Plant:
Steam production asbestos........................ $
—
$ 5,917 $
—
$ 28,406 $
—
$ 34,323
Steam production ash containment.................
—
4,916
—
16,018
—
20,934
Steam production retirement...................... 3,002
—
—
150
—
3,152
Nuclear production decommissioning............... 1,088,087
—
—
70,736 26,145 1,184,968
Electric transmission and distribution...............
—
2,350
—
—
—
2,350
Gas Utility Plant:
Gas transmission and distribution..................
—
43,245
—
—
—
43,245
Common Utility and Other Property:
Common general plant asbestos ...................
—
575
—
2,459
—
3,034
Total liability ................................. $1,091,089 $57,003 $
—
$117,769 $26,145 $1,292,006
The fair value of NSP-Minnesota assets legally restricted, for purposes of settling the nuclear asset retirement obligation is $1.2 billion
as of Dec. 31, 2006, including external nuclear decommissioning investment funds and internally funded amounts.
Indeterminate Asset Retirement Obligations — PSCo has underground natural gas storage facilities that have special closure
requirements for which the final removal date cannot be determined.
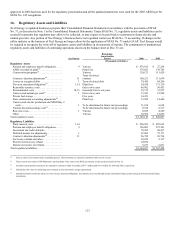
Removal Costs — Xcel Energy accrues an obligation for plant removal costs for other generation, transmission and distribution
facilities of its utility subsidiaries. Generally, the accrual of future non-ARO removal obligations is not required. However, long-
standing ratemaking practices approved by applicable state and federal regulatory commissions have allowed provisions for such costs
in historical depreciation rates. These removal costs have accumulated over a number of years based on varying rates as authorized by
the appropriate regulatory entities. Given the long periods over which the amounts were accrued and the changing of rates through
time, the utility subsidiaries have estimated the amount of removal costs accumulated through historic depreciation expense based on
current factors used in the existing depreciation rates.
Accordingly, the recorded amounts of estimated future removal costs are considered Regulatory Liabilities under SFAS No. 71.
Removal costs by entity are as follows at Dec. 31:
2006 2005
(Millions of Dollars)
NSP-Minnesota............................................... $355 $334
NSP-Wisconsin............................................... 91 86
PSCo........................................................ 389 377
SPS......................................................... 85 98
Total Xcel Energy ........................................... $920 $895
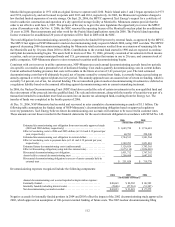
Nuclear Insurance — NSP-Minnesota’s public liability for claims resulting from any nuclear incident is limited to $10.8 billion
under the 1988 Price-Anderson amendment to the Atomic Energy Act of 1954. NSP-Minnesota has secured $300 million of coverage
for its public liability exposure with a pool of insurance companies. The remaining $10.5 billion of exposure is funded by the
Secondary Financial Protection Program, available from assessments by the federal government in case of a nuclear accident. NSP-
Minnesota is subject to assessments of up to $100.6 million for each of its three licensed reactors, to be applied for public liability