Xcel Energy 2006 Annual Report Download - page 69
Download and view the complete annual report
Please find page 69 of the 2006 Xcel Energy annual report below. You can navigate through the pages in the report by either clicking on the pages listed below, or by using the keyword search tool below to find specific information within the annual report.
59
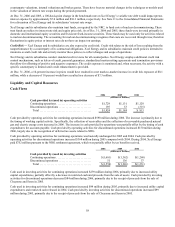
2006 2005 2004
(Millions of Dollars)
Cash provided by (used in) financing activities
Continuing operations.......................... $(422) $111 $(111)
Total...................................... $(422) $111 $(111)
Cash flow from financing activities related to continuing operations decreased $533 million during 2006 due to increased net
repayments of short-term borrowings in 2006 compared to 2005.
Cash flow from financing activities related to continuing operations increased $222 million during 2005 primarily due to increased
short-term borrowings.
See discussion of trends, commitments and uncertainties with the potential for future impact on cash flow and liquidity under Capital
Sources.
Capital Requirements
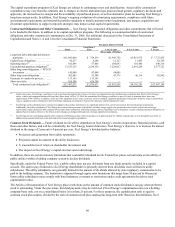
Utility Capital Expenditures and Long-Term Debt Obligations — The estimated cost of the capital expenditure programs of Xcel
Energy and its subsidiaries, excluding discontinued operations, and other capital requirements for the years 2007 through 2011 are
shown in the tables below.
By Segment 2007 2008 2009 2010 2011
(Millions of Dollars)
Electric utility ............................. $1,723 $1,692 $1,466 $1,623 $1,503
Natural gas utility .......................... 117 141 165 139 121
Common utility and other ................... 60 67 69 88 76
Total capital expenditures.................. 1,900 1,900 1,700 1,850 1,700
Debt maturities ............................ 336 632 558 783 52
Total capital requirements ................. $2,236 $2,532 $2,258 $2,633 $1,752
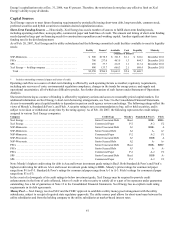
By Utility Subsidiary 2007 2008 2009 2010 2011
(Millions of Dollars)
NSP-Minnesota............................ $ 995 $1,050 $1,000 $1,090 $ 995
NSP-Wisconsin............................ 75 85 55 60 65
PSCo .................................... 690 635 515 580 490
SPS...................................... 140 130 130 120 150
Total................................... $1,900 $1,900 $1,700 $1,850 $1,700
By Project 2007 2008 2009 2010 2011
(Millions of Dollars)
Base and other capital expenditures ........... $ 955 $ 950 $ 950 $1,000 $ 965
MERP ................................... 275 170 35 10
—
Comanche 3............................... 345 275 55 15
—
Minnesota wind transmission ................ 150 20 50 15
—
Minnesota wind generation .................. 50 155
—
—
—
CapX 2020 transmission .................... 5 20 110 240 180
BART projects ............................
—
5 40 65 40
Sherco capacity increases.................... 10 65 200 245 165
Nuclear fuel............................... 90 160 145 105 165
Nuclear capacity increases and life extension . . . 20 80 115 155 185
Total................................... $1,900 $1,900 $1,700 $1,850 $1,700
Many of the states in which Xcel Energy has operations are considering renewable portfolio standards, which would require
significant increases in investment in renewable generation and transmission. Xcel Energy would generally be able to meet these
standards by either purchasing renewable power from an independent party or by owning the assets. Therefore, these standards may
present Xcel Energy with the opportunity to increase its investment in wind generation and transmission assets. As a result, Xcel
Energy’s capital expenditure forecast, as detailed above, may increase due to the potential increased investments for wind generation,
IGCC and transmission assets.


