Xcel Energy 2006 Annual Report Download - page 30
Download and view the complete annual report
Please find page 30 of the 2006 Xcel Energy annual report below. You can navigate through the pages in the report by either clicking on the pages listed below, or by using the keyword search tool below to find specific information within the annual report.-
 1
1 -
2
-
3
-
4
-
5
-
6
-
7
-
8
-
9
-
10
-
11
-
12
-
13
-
14
-
15
-
16
-
17
-
18
-
19
-
 20
20 -
 21
21 -
 22
22 -
 23
23 -
 24
24 -
 25
25 -
 26
26 -
 27
27 -
 28
28 -
 29
29 -
 30
30 -
 31
31 -
 32
32 -
 33
33 -
 34
34 -
 35
35 -
 36
36 -
 37
37 -
 38
38 -
 39
39 -
 40
40 -
41
-
42
-
43
-
44
-
45
-
46
-
47
-
48
-
49
-
50
-
51
-
52
-
53
-
54
-
55
-
56
-
57
-
58
-
59
-
60
-
61
-
62
-
63
-
64
-
65
-
66
-
67
-
68
-
69
-
70
-
71
-
72
-
73
-
74
-
75
-
76
-
77
-
78
-
79
-
80
-
81
-
82
-
83
-
84
-
85
-
86
-
87
-
88
-
89
-
90
-
91
-
92
-
93
-
94
-
95
-
96
-
97
-
98
-
99
-
100
-
101
-
102
-
103
-
104
-
105
-
106
-
107
-
108
-
109
-
110
-
111
-
112
-
113
-
114
-
115
-
116
-
117
-
118
-
119
-
120
-
121
-
122
-
123
-
124
-
125
-
126
-
127
-
128
-
129
-
130
-
131
-
132
-
133
-
134
-
135
-
136
-
137
-
138
-
139
-
140
-
141
-
142
-
143
-
144
-
145
-
146
-
147
-
148
-
149
-
150
-
151
-
152
-
153
-
154
-
155
-
156
 |
 |

20
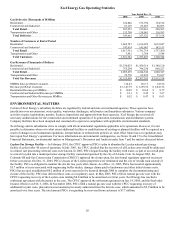
Fuel Supply and Costs
The following table shows the delivered cost per MMBtu of each significant category of fuel consumed for electric generation, the
percentage of total fuel requirements represented by each category of fuel and the total weighted average cost of all fuels.
SPS Generating Coal Natural Gas Average Fuel
Plants Cost Percent Cost Percent Cost
2006........................................ $ 1.89 66% $ 6.30 34% $ 3.38
2005........................................ $ 1.32 68% $ 7.77 32% $ 3.38
2004........................................ $ 1.20 69% $ 5.74 31% $ 2.60
See additional discussion of fuel supply and costs under Factors Affecting Results of Continuing Operations in Management’s
Discussion and Analysis under Item 7.
Fuel Sources — SPS purchases all of its coal requirements for its two coal facilities, Harrington and Tolk electric generating stations,
from TUCO, Inc. in the form of crushed, ready-to-burn coal delivered to the plant bunkers. TUCO arranges for the purchase,
receiving, transporting, unloading, handling, crushing, weighing, and delivery of coal to the plant bunkers to meet SPS’ requirements.
TUCO is responsible for negotiating and administering contracts with coal suppliers, transporters, and handlers. For the Harrington
station, the coal supply contract with TUCO expires in 2016. For the Tolk station, the coal supply contract with TUCO expires in
2017. At Dec. 31, 2006, coal supplies at the Harrington and Tolk sites were approximately 37 and 37 days supply, respectively. TUCO
has coal agreements to supply 100 percent of SPS’ coal requirements in 2007, 2008 and 2009 for the Harrington and Tolk stations.
TUCO has long-term contracts for supply of coal in sufficient quantities to meet the primary needs of the Harrington and Tolk
stations.
SPS uses both firm and interruptible natural gas and standby oil in combustion turbines and certain boilers. Natural gas suppliers for
SPS’ power plants are procured under short- and intermediate-term contracts to provide an adequate supply of fuel. These contracts
expire in various years from 2007 through 2011. Certain natural gas supply and transportation agreements include obligations for the
purchase and/or delivery of specified volumes of natural gas or to make payments in lieu of delivery. At Dec. 31, 2006, SPS’
commitments related to these contracts were approximately $30 million.
Commodity Marketing Operations
SPS conducts various wholesale marketing operations, including the purchase and sale of electric capacity, energy and energy related
products. SPS uses physical and financial instruments to minimize commodity price and credit risk and hedge supplies and purchases.
See additional discussion under Item 7A — Quantitative and Qualitative Disclosures About Market Risk.