Xcel Energy 2006 Annual Report Download - page 57
Download and view the complete annual report
Please find page 57 of the 2006 Xcel Energy annual report below. You can navigate through the pages in the report by either clicking on the pages listed below, or by using the keyword search tool below to find specific information within the annual report.-
 1
1 -
2
-
3
-
4
-
5
-
6
-
7
-
8
-
9
-
10
-
11
-
12
-
13
-
14
-
15
-
16
-
17
-
18
-
19
-
20
-
21
-
22
-
23
-
24
-
25
-
26
-
27
-
28
-
29
-
30
-
31
-
32
-
33
-
34
-
35
-
36
-
37
-
38
-
39
-
40
-
41
-
42
-
43
-
44
-
45
-
46
-
 47
47 -
 48
48 -
 49
49 -
 50
50 -
 51
51 -
 52
52 -
 53
53 -
 54
54 -
 55
55 -
 56
56 -
 57
57 -
 58
58 -
 59
59 -
 60
60 -
 61
61 -
 62
62 -
 63
63 -
 64
64 -
 65
65 -
 66
66 -
 67
67 -
68
-
69
-
70
-
71
-
72
-
73
-
74
-
75
-
76
-
77
-
78
-
79
-
80
-
81
-
82
-
83
-
84
-
85
-
86
-
87
-
88
-
89
-
90
-
91
-
92
-
93
-
94
-
95
-
96
-
97
-
98
-
99
-
100
-
101
-
102
-
103
-
104
-
105
-
106
-
107
-
108
-
109
-
110
-
111
-
112
-
113
-
114
-
115
-
116
-
117
-
118
-
119
-
120
-
121
-
122
-
123
-
124
-
125
-
126
-
127
-
128
-
129
-
130
-
131
-
132
-
133
-
134
-
135
-
136
-
137
-
138
-
139
-
140
-
141
-
142
-
143
-
144
-
145
-
146
-
147
-
148
-
149
-
150
-
151
-
152
-
153
-
154
-
155
-
156
 |
 |

47
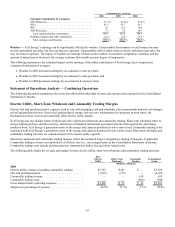
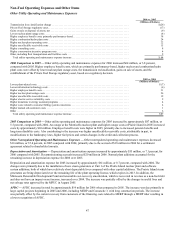
Non-Fuel Operating Expenses and Other Items
Other Utility Operating and Maintenance Expenses
2006 vs. 2005
(Millions of Dollars)
Transmission fees classification change ........................................................... $ (26)
Private Fuel Storage regulatory asset.............................................................. (17)
Gains on sale or disposal of assets, net ............................................................ (9)
Lower nuclear plant outage costs................................................................. (4)
Higher employee benefit costs, primarily performance-based........................................... 38
Higher combustion/hydro plant costs ............................................................. 24
Higher nuclear plant operating costs.............................................................. 22
Higher uncollectible receivable costs ............................................................. 15
Higher consulting costs........................................................................ 8
Higher conservation incentive program costs ....................................................... 4
Other, including fleet transportation and facilities costs............................................... 9
Total utility operating and maintenance expense increase............................................ $ 64
2006 Comparison to 2005 — Other utility operating and maintenance expenses for 2006 increased $64 million, or 3.8 percent,
compared with 2005. Higher employee benefit costs, which are primarily performance-based, higher nuclear and combustion/hydro
plant costs were offset by lower nuclear plant outage costs, the transmission reclassification, gains on sale of assets, and the
establishment of the Private Fuel Storage regulatory asset, based on a regulatory decision.
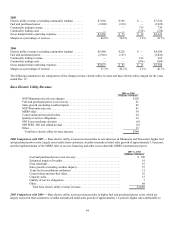
2005 vs. 2004
(Millions of Dollars)
Lower plant-related costs....................................................................... $ (7)
Lower information technology costs .............................................................. (6)
Higher employee benefit costs................................................................... 31
Higher nuclear plant outage costs................................................................ 26
Higher uncollectible receivable costs ............................................................. 19
Higher electric service reliability costs............................................................ 9
Higher donations to energy assistant programs ...................................................... 4
Higher costs related to customer billing system conversion ............................................ 4
Higher mutual aid assistance costs ............................................................... 1
Other...................................................................................... 6
Total utility operating and maintenance expense increase............................................ $ 87
2005 Comparison to 2004 — Other utility operating and maintenance expenses for 2005 increased by approximately $87 million, or
5.5 percent, compared with 2004. An outage at the Monticello nuclear plant and higher outage costs at Prairie Island in 2005 increased
costs by approximately $26 million. Employee benefit costs were higher in 2005, primarily due to increased pension benefits and
long-term disability costs. Also contributing to the increase was higher uncollectible receivable costs, attributable in part, to
modifications to the bankruptcy laws, higher fuel prices and certain changes in the credit and collection process.
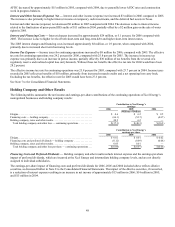
Other Nonregulated Operating and Maintenance Expenses — Other nonregulated operating and maintenance expenses decreased
$16 million, or 35.4 percent, in 2005 compared with 2004, primarily due to the accrual of $18 million in 2004 for a settlement
agreement related to shareholder lawsuits.
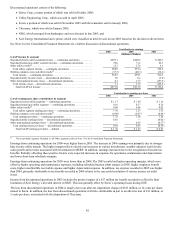
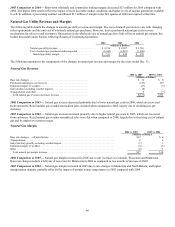
Depreciation and Amortization — Depreciation and amortization expense increased by approximately $55 million, or 7.1 percent, for
2006 compared with 2005. Decommissioning accruals increased $20 million in 2006. Normal plant additions accounted for the
remaining increase in depreciation expense for 2006 over 2005.
Depreciation and amortization expense for 2005 increased by approximately $61 million, or 8.7 percent, compared with 2004. The
changes were primarily due to the installation of new steam generators at Unit 1 of the Prairie Island nuclear plant and software
system additions, both of which have relatively short depreciable lives compared with other capital additions. The Prairie Island steam
generators are being depreciated over the remaining life of the plant operating license, which expires in 2013. In addition, the
Minnesota Renewable Development Fund and renewable cost-recovery amortization, which is recovered in revenue as a non-fuel rider
and does not have an impact on net income, increased over 2004. The increase was partially offset by the changes in useful lives and
net salvage rates approved by the MPUC in August 2005.
AFDC — AFDC increased in total by approximately $14 million for 2006 when compared to 2005. The increase was due primarily to
large capital projects beginning in 2005 and 2006, including MERP and Comanche 3, with long construction periods. The increase
was partially offset by the current recovery from customers of the financing costs related to MERP through a MERP rider resulting in
a lower recognition of AFDC.