Xcel Energy 2006 Annual Report Download - page 91
Download and view the complete annual report
Please find page 91 of the 2006 Xcel Energy annual report below. You can navigate through the pages in the report by either clicking on the pages listed below, or by using the keyword search tool below to find specific information within the annual report.-
 1
1 -
2
-
3
-
4
-
5
-
6
-
7
-
8
-
9
-
10
-
11
-
12
-
13
-
14
-
15
-
16
-
17
-
18
-
19
-
20
-
21
-
22
-
23
-
24
-
25
-
26
-
27
-
28
-
29
-
30
-
31
-
32
-
33
-
34
-
35
-
36
-
37
-
38
-
39
-
40
-
41
-
42
-
43
-
44
-
45
-
46
-
47
-
48
-
49
-
50
-
51
-
52
-
53
-
54
-
55
-
56
-
57
-
58
-
59
-
60
-
61
-
62
-
63
-
64
-
65
-
66
-
67
-
68
-
69
-
70
-
71
-
72
-
73
-
74
-
75
-
76
-
77
-
78
-
79
-
80
-
 81
81 -
 82
82 -
 83
83 -
 84
84 -
 85
85 -
 86
86 -
 87
87 -
 88
88 -
 89
89 -
 90
90 -
 91
91 -
 92
92 -
 93
93 -
 94
94 -
 95
95 -
 96
96 -
 97
97 -
 98
98 -
 99
99 -
 100
100 -
 101
101 -
102
-
103
-
104
-
105
-
106
-
107
-
108
-
109
-
110
-
111
-
112
-
113
-
114
-
115
-
116
-
117
-
118
-
119
-
120
-
121
-
122
-
123
-
124
-
125
-
126
-
127
-
128
-
129
-
130
-
131
-
132
-
133
-
134
-
135
-
136
-
137
-
138
-
139
-
140
-
141
-
142
-
143
-
144
-
145
-
146
-
147
-
148
-
149
-
150
-
151
-
152
-
153
-
154
-
155
-
156
 |
 |

81
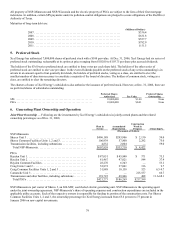
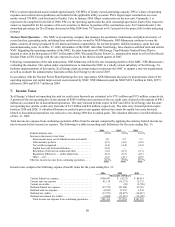
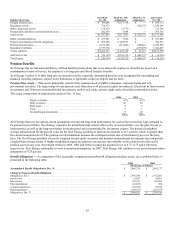
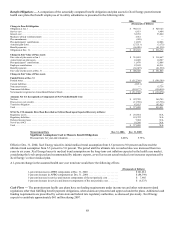
The components of Xcel Energy’s net deferred tax liability from continuing operations (current and noncurrent portions) at Dec. 31
were:
2006 2005
(Thousands of Dollars)
Deferred tax liabilities:
Differences between book and tax bases of property ................. $ 2,279,184 $ 2,245,748
Regulatory assets ............................................ 182,354 257,843
Employee benefits............................................ 25,291 25,711
Service contracts............................................. 7,592 8,539
Partnership income/loss ....................................... 4,248 10,010
Other...................................................... 28,399 85,810
Total deferred tax liabilities ...................................... $ 2,527,068 $ 2,633,661
Deferred tax assets:
Net operating loss carry forward................................. $ 101,608 $ 119,124
Tax credit carry forward....................................... 99,025 86,143
Other comprehensive income................................... 14,808 80,356
Deferred investment tax credits.................................. 47,517 51,286
Regulatory liabilities.......................................... 41,199 40,835
Accrued liabilities and other.................................... 71,626 46,106
Total deferred tax assets......................................... $ 375,783 $ 423,850
Net deferred tax liability..................................... $ 2,151,285 $ 2,209,811
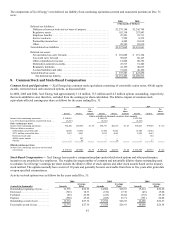
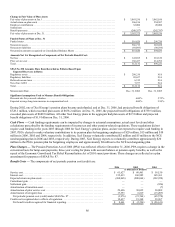
8. Common Stock and Stock-Based Compensation
Common Stock and Equivalents — Xcel Energy has common stock equivalents consisting of convertible senior notes, 401(k) equity
awards, restricted stock units and stock options, as discussed later.
In 2006, 2005 and 2004, Xcel Energy had approximately 11.0 million, 13.3 million and 14.3 million options outstanding, respectively,
that were antidilutive and, therefore, excluded from the earnings per share calculation. The dilutive impact of common stock
equivalents affected earnings per share as follows for the years ending Dec. 31:
2006 2005 2004
Income Shares
Per
Share
Amount Income Shares
Per
Share
Amount Income Shares
Per
Share
Amount
(Shares and dollars in thousands, except per share amounts)
Income from continuing operations............ $ 568,681 $ 499,038 $ 522,264
Less: Dividend requirements on preferred stock . . . (4,241) (4,241) (4,241)
Basic earnings per share
Income from continuing operations............ 564,440 405,689 $ 1.39 494,797 402,330 $ 1.23 518,023 399,456 $ 1.30
Effect of dilutive securities:
$230 million convertible debt .............. 12,090 18,654 11,498 18,654 11,940 18,654
$57.5 million convertible debt .............. 3,022 4,663 2,875 4,663 2,985 4,663
Restricted stock units .................... — — — — — 544
401(k) equity awards .................... — 551 — — —
—
Options.............................. — 48 — 24 — 17
Diluted earnings per share
Income from continuing operations and assumed
conversions ........................... $ 579,552 429,605 $ 1.35 $ 509,170 425,671 $ 1.20 $ 532,948 423,334 $ 1.26
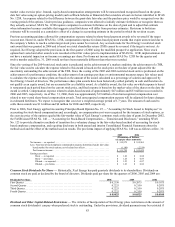
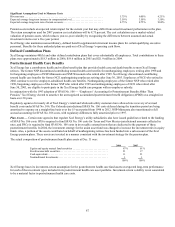
Stock-Based Compensation — Xcel Energy has incentive compensation plans under which stock options and other performance
incentives are awarded to key employees. The weighted average number of common and potentially dilutive shares outstanding used
to calculate Xcel Energy’s earnings per share include the dilutive effect of stock options and other stock awards based on the treasury
stock method. The options normally have a term of 10 years and generally become exercisable from three to five years after grant date
or upon specified circumstances.
Activity in stock options was as follows for the years ended Dec. 31:
2006 2005 2004
(Awards in thousands) Awards
Average
Price Awards
Average
Price Awards
Average
Price
Outstanding beginning of year...... 13,576 $ 26.92 14,606 $ 26.67 15,614 $ 26.49
Exercised...................... (563) 18.33 (152) 17.30 (45) 15.08
Forfeited ...................... (89) 26.98 (213) 26.84 (172) 25.10
Expired ....................... (550) 25.66 (665) 23.71 (791) 24.08
Outstanding at end of year......... 12,374 $ 27.36 13,576 $ 26.92 14,606 $ 26.67
Exercisable at end of year......... 12,374 $ 27.36 13,529 $ 26.91 10,096 $ 26.58