Xcel Energy 2006 Annual Report Download - page 56
Download and view the complete annual report
Please find page 56 of the 2006 Xcel Energy annual report below. You can navigate through the pages in the report by either clicking on the pages listed below, or by using the keyword search tool below to find specific information within the annual report.-
 1
1 -
2
-
3
-
4
-
5
-
6
-
7
-
8
-
9
-
10
-
11
-
12
-
13
-
14
-
15
-
16
-
17
-
18
-
19
-
20
-
21
-
22
-
23
-
24
-
25
-
26
-
27
-
28
-
29
-
30
-
31
-
32
-
33
-
34
-
35
-
36
-
37
-
38
-
39
-
40
-
41
-
42
-
43
-
44
-
45
-
 46
46 -
 47
47 -
 48
48 -
 49
49 -
 50
50 -
 51
51 -
 52
52 -
 53
53 -
 54
54 -
 55
55 -
 56
56 -
 57
57 -
 58
58 -
 59
59 -
 60
60 -
 61
61 -
 62
62 -
 63
63 -
 64
64 -
 65
65 -
 66
66 -
67
-
68
-
69
-
70
-
71
-
72
-
73
-
74
-
75
-
76
-
77
-
78
-
79
-
80
-
81
-
82
-
83
-
84
-
85
-
86
-
87
-
88
-
89
-
90
-
91
-
92
-
93
-
94
-
95
-
96
-
97
-
98
-
99
-
100
-
101
-
102
-
103
-
104
-
105
-
106
-
107
-
108
-
109
-
110
-
111
-
112
-
113
-
114
-
115
-
116
-
117
-
118
-
119
-
120
-
121
-
122
-
123
-
124
-
125
-
126
-
127
-
128
-
129
-
130
-
131
-
132
-
133
-
134
-
135
-
136
-
137
-
138
-
139
-
140
-
141
-
142
-
143
-
144
-
145
-
146
-
147
-
148
-
149
-
150
-
151
-
152
-
153
-
154
-
155
-
156
 |
 |

46
2005 Comparison to 2004 — Short-term wholesale and commodity trading margins decreased $25 million for 2005 compared with
2004. The higher 2004 results reflect the impact of more favorable market conditions and higher levels of surplus generation available
to sell. In addition, a preexisting contract contributed $17 million of margin in the first quarter of 2004 and expired at that time.
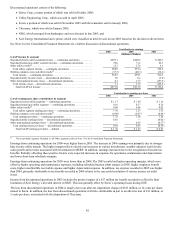
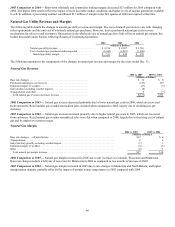
Natural Gas Utility Revenue and Margins
The following table details the changes in natural gas utility revenue and margin. The cost of natural gas tends to vary with changing
sales requirements and the unit cost of wholesale natural gas purchases. However, due to purchased natural gas cost-recovery
mechanisms for sales to retail customers, fluctuations in the wholesale cost of natural gas have little effect on natural gas margin. See
further discussion under Factors Affecting Results of Continuing Operations.
2006 2005 2004
(Millions of Dollars)
Natural gas utility revenue .......................... $ 2,156 $ 2,307 $ 1,916
Cost of natural gas purchased and transported ........... (1,645) (1,823 ) (1,446 )
Natural gas utility margin......................... $ 511 $ 484 $ 470
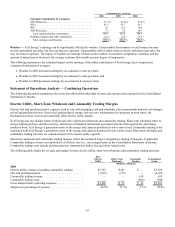
The following summarizes the components of the changes in natural gas revenue and margin for the years ended Dec. 31:
Natural Gas Revenue
2006 vs. 2005 2005 vs. 2004
(Millions of Dollars)
Base rate changes.............................................. $ 32 $ 6
Purchased natural gas cost recovery ............................... (147) 397
Estimated impact of weather..................................... (33) (5)
Sales decline (excluding weather impact)........................... (8)
—
Transportation and other........................................ 5 (7)
Total natural gas revenue (decrease) increase...................... $ (151) $ 391
2006 Comparison to 2005 — Natural gas revenue decreased primarily due to lower natural gas costs in 2006, which are recovered
from customers. Retail natural gas weather-normalized sales declined when compared to 2005, largely due to declining use per
customer.
2005 Comparison to 2004 — Natural gas revenue increased primarily due to higher natural gas costs in 2005, which are recovered
from customers. Retail natural gas weather-normalized sales were flat when compared to 2004, largely due to the rising cost of natural
gas and its impact on customer usage.
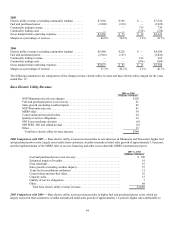
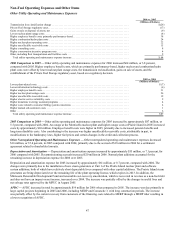
Natural Gas Margin
2006 vs. 2005 2005 vs. 2004
(Millions of Dollars)
Base rate changes — all jurisdictions .................................................. $ 32 $ 6
Transportation.................................................................... 8 6
Sales (decline) growth, excluding weather impact......................................... (7) 1
Estimated impact of weather......................................................... (4) (2)
Other........................................................................... (2) 3
Total natural gas margin increase ................................................... $ 27 $ 14
2006 Comparison to 2005 — Natural gas margins increased in 2006 due to rate increases in Colorado, Wisconsin and Minnesota.
Base rate changes include a full year of new rates for Minnesota in 2006 as compared to two months of increase in 2005.
2005 Comparison to 2004 — Natural gas margin increased in 2005 due to rate changes in Minnesota and North Dakota, and higher
transportation margins, partially offset by the impact of warmer winter temperatures in 2005 compared with 2004.