Xcel Energy 2006 Annual Report Download - page 59
Download and view the complete annual report
Please find page 59 of the 2006 Xcel Energy annual report below. You can navigate through the pages in the report by either clicking on the pages listed below, or by using the keyword search tool below to find specific information within the annual report.-
 1
1 -
2
-
3
-
4
-
5
-
6
-
7
-
8
-
9
-
10
-
11
-
12
-
13
-
14
-
15
-
16
-
17
-
18
-
19
-
20
-
21
-
22
-
23
-
24
-
25
-
26
-
27
-
28
-
29
-
30
-
31
-
32
-
33
-
34
-
35
-
36
-
37
-
38
-
39
-
40
-
41
-
42
-
43
-
44
-
45
-
46
-
47
-
48
-
 49
49 -
 50
50 -
 51
51 -
 52
52 -
 53
53 -
 54
54 -
 55
55 -
 56
56 -
 57
57 -
 58
58 -
 59
59 -
 60
60 -
 61
61 -
 62
62 -
 63
63 -
 64
64 -
 65
65 -
 66
66 -
 67
67 -
 68
68 -
 69
69 -
70
-
71
-
72
-
73
-
74
-
75
-
76
-
77
-
78
-
79
-
80
-
81
-
82
-
83
-
84
-
85
-
86
-
87
-
88
-
89
-
90
-
91
-
92
-
93
-
94
-
95
-
96
-
97
-
98
-
99
-
100
-
101
-
102
-
103
-
104
-
105
-
106
-
107
-
108
-
109
-
110
-
111
-
112
-
113
-
114
-
115
-
116
-
117
-
118
-
119
-
120
-
121
-
122
-
123
-
124
-
125
-
126
-
127
-
128
-
129
-
130
-
131
-
132
-
133
-
134
-
135
-
136
-
137
-
138
-
139
-
140
-
141
-
142
-
143
-
144
-
145
-
146
-
147
-
148
-
149
-
150
-
151
-
152
-
153
-
154
-
155
-
156
 |
 |

49
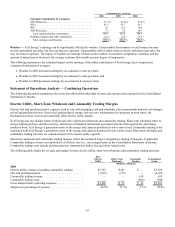
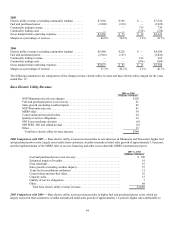
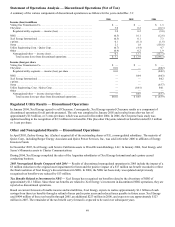
Statement of Operations Analysis — Discontinued Operations (Net of Tax)
A summary of the various components of discontinued operations is as follows for the years ended Dec. 31:
2006 2005 2004
Income (loss) in millions
Viking Gas Transmission Co........................................ $
—
$ — $ 1.3
Cheyenne....................................................... 3.0 0.2 (10.3)
Regulated utility segments — income (loss).......................... 3.0 0.2 (9.0)
NRG .......................................................... (0.5) 16.1 (12.8)
Xcel Energy International.......................................... (0.5) 0.1 7.3
e prime......................................................... 0.1 (0.1) (1.8)
Seren.......................................................... 2.1 1.8 (156.6)
Utility Engineering Corp. / Quixx Corp. ............................... (0.7) (4.4) 4.7
Other.......................................................... (0.4) 0.2 1.9
Nonregulated/other — income (loss)................................ 0.1 13.7 (157.3)
Total income (loss) from discontinued operations.................... $ 3.1 $ 13.9 $ (166.3)
Income (loss) per share
Viking Gas Transmission Co........................................ $
—
$ — $
—
Cheyenne....................................................... 0.01 — (0.02)
Regulated utility segments — income (loss) per share .................. 0.01 — (0.02)
NRG ..........................................................
—
0.04 (0.03)
Xcel Energy International..........................................
—
— 0.02
e prime.........................................................
—
—
—
Seren..........................................................
—
— (0.37)
Utility Engineering, Corp. / Quixx Corp................................
—
(0.01) 0.01
Other..........................................................
—
—
—
Nonregulated/other — income (loss) per share........................
—
0.03 (0.37)
Total income (loss) per share from discontinued operations............ $ 0.01 $ 0.03 $ (0.39)
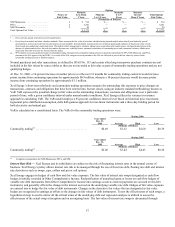
Regulated Utility Results — Discontinued Operations
In January 2004, Xcel Energy agreed to sell Cheyenne. Consequently, Xcel Energy reported Cheyenne results as a component of
discontinued operations for all periods presented. The sale was completed in January 2005 and resulted in an after-tax loss of
approximately $13 million, or 3 cents per share, which was accrued in December 2004. In 2006, the Cheyenne basis study was
updated resulting in the recognition of $2.3 million in tax benefits. This plus other Cheyenne related tax benefits totaled $3.3 million
or 1 cent per share.
Other and Nonregulated Results — Discontinued Operations
In April 2005, Zachry Group, Inc. (Zachry) acquired all of the outstanding shares of UE, a nonregulated subsidiary. The majority of
Quixx Corp., including Borger Energy Associates and Quixx Power Services, Inc., was sold in October 2006 to affiliates of Energy
Investors Funds.
In November 2005, Xcel Energy sold Seren’s California assets to WaveDivision Holdings, LLC. In January 2006, Xcel Energy sold
Seren’s Minnesota assets to Charter Communications.
During 2004, Xcel Energy completed the sales of the Argentina subsidiaries of Xcel Energy International and e prime ceased
conducting business.
2005 Nonregulated Results Compared with 2004 — Results of discontinued nonregulated operations in 2005 include the impact of a
$5 million reduction to the original asset impairment for Seren and the positive impact of a $17 million tax benefit recorded to reflect
the final resolution of Xcel Energy’s divested interest in NRG. In 2004, the NRG tax basis study was updated and previously
recognized tax benefits were reduced by $13 million.
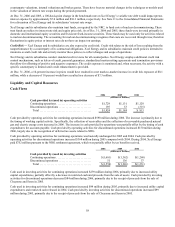
Tax Benefits Related to Investment in NRG — Xcel Energy has recognized tax benefits related to the divestiture of NRG of
approximately $1.1 billion. Since these tax benefits are related to Xcel Energy’s investment in discontinued NRG operations, they are
reported as discontinued operations.
Based on current forecasts of taxable income and tax liabilities, Xcel Energy expects to realize approximately $1.1 billion of cash
savings from these tax benefits through a refund of taxes paid in prior years and reduced taxes payable in future years. Xcel Energy
used $404 million of these tax benefits through 2005, an additional $223 million in 2006, and expects to use approximately $123
million in 2007. The remainder of the tax benefit carry forward is expected to be used over subsequent years.