Xcel Energy 2006 Annual Report Download - page 136
Download and view the complete annual report
Please find page 136 of the 2006 Xcel Energy annual report below. You can navigate through the pages in the report by either clicking on the pages listed below, or by using the keyword search tool below to find specific information within the annual report.-
 1
1 -
2
-
3
-
4
-
5
-
6
-
7
-
8
-
9
-
10
-
11
-
12
-
13
-
14
-
15
-
16
-
17
-
18
-
19
-
20
-
21
-
22
-
23
-
24
-
25
-
26
-
27
-
28
-
29
-
30
-
31
-
32
-
33
-
34
-
35
-
36
-
37
-
38
-
39
-
40
-
41
-
42
-
43
-
44
-
45
-
46
-
47
-
48
-
49
-
50
-
51
-
52
-
53
-
54
-
55
-
56
-
57
-
58
-
59
-
60
-
61
-
62
-
63
-
64
-
65
-
66
-
67
-
68
-
69
-
70
-
71
-
72
-
73
-
74
-
75
-
76
-
77
-
78
-
79
-
80
-
81
-
82
-
83
-
84
-
85
-
86
-
87
-
88
-
89
-
90
-
91
-
92
-
93
-
94
-
95
-
96
-
97
-
98
-
99
-
100
-
101
-
102
-
103
-
104
-
105
-
106
-
107
-
108
-
109
-
110
-
111
-
112
-
113
-
114
-
115
-
116
-
117
-
118
-
119
-
120
-
121
-
122
-
123
-
124
-
125
-
 126
126 -
 127
127 -
 128
128 -
 129
129 -
 130
130 -
 131
131 -
 132
132 -
 133
133 -
 134
134 -
 135
135 -
 136
136 -
 137
137 -
 138
138 -
 139
139 -
 140
140 -
 141
141 -
 142
142 -
 143
143 -
 144
144 -
 145
145 -
 146
146 -
147
-
148
-
149
-
150
-
151
-
152
-
153
-
154
-
155
-
156
 |
 |

126
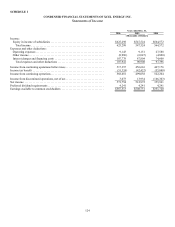
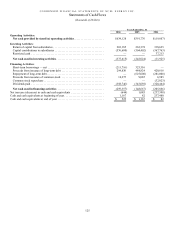
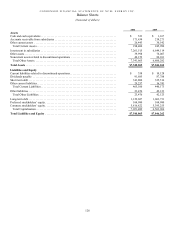
CONDENSED FINANCIAL STATEMENTS OF XCEL ENERGY INC.
Balance Sheets
(thousands of dollars)
2006 2005
Assets
Cash and cash equivalents....................................................... $ 523 $ 1,167
Accounts receivable from subsidiaries ............................................. 171,434 214,271
Other current assets ............................................................ 26,443 30,542
Total Current Assets.......................................................... 198,400 245,980
Investment in subsidiaries ....................................................... 7,261,515 6,644,114
Other assets................................................................... 39,998 76,067
Noncurrent assets related to discontinued operations ................................. 40,152 80,101
Total Other Assets............................................................ 7,341,665 6,800,282
Total Assets .................................................................. $7,540,065 $7,046,262
Liabilities and Equity
Current liabilities related to discontinued operations.................................. $ 358 $ 10,128
Dividends payable ............................................................. 91,685 87,788
Short term debt................................................................ 343,800 325,516
Other current liabilities.......................................................... 29,257 16,741
Total Current Liabilities ....................................................... 465,100 440,173
Other liabilities ................................................................ 23,476 42,123
Total Other Liabilities......................................................... 23,476 42,123
Long-term debt................................................................ 1,129,687 1,063,731
Preferred stockholders’ equity.................................................... 104,980 104,980
Common stockholders’ equity.................................................... 5,816,822 5,395,255
Total Capitalization........................................................... 7,051,489 6,563,966
Total Liabilities and Equity .................................................... $7,540,065 $7,046,262