Xcel Energy 2006 Annual Report Download - page 58
Download and view the complete annual report
Please find page 58 of the 2006 Xcel Energy annual report below. You can navigate through the pages in the report by either clicking on the pages listed below, or by using the keyword search tool below to find specific information within the annual report.-
 1
1 -
2
-
3
-
4
-
5
-
6
-
7
-
8
-
9
-
10
-
11
-
12
-
13
-
14
-
15
-
16
-
17
-
18
-
19
-
20
-
21
-
22
-
23
-
24
-
25
-
26
-
27
-
28
-
29
-
30
-
31
-
32
-
33
-
34
-
35
-
36
-
37
-
38
-
39
-
40
-
41
-
42
-
43
-
44
-
45
-
46
-
47
-
 48
48 -
 49
49 -
 50
50 -
 51
51 -
 52
52 -
 53
53 -
 54
54 -
 55
55 -
 56
56 -
 57
57 -
 58
58 -
 59
59 -
 60
60 -
 61
61 -
 62
62 -
 63
63 -
 64
64 -
 65
65 -
 66
66 -
 67
67 -
 68
68 -
69
-
70
-
71
-
72
-
73
-
74
-
75
-
76
-
77
-
78
-
79
-
80
-
81
-
82
-
83
-
84
-
85
-
86
-
87
-
88
-
89
-
90
-
91
-
92
-
93
-
94
-
95
-
96
-
97
-
98
-
99
-
100
-
101
-
102
-
103
-
104
-
105
-
106
-
107
-
108
-
109
-
110
-
111
-
112
-
113
-
114
-
115
-
116
-
117
-
118
-
119
-
120
-
121
-
122
-
123
-
124
-
125
-
126
-
127
-
128
-
129
-
130
-
131
-
132
-
133
-
134
-
135
-
136
-
137
-
138
-
139
-
140
-
141
-
142
-
143
-
144
-
145
-
146
-
147
-
148
-
149
-
150
-
151
-
152
-
153
-
154
-
155
-
156
 |
 |

48
AFDC decreased by approximately $15 million in 2005, compared with 2004, due to generally lower AFDC rates and construction
work in progress balances.
Interest and Other Income (Expense) Net — Interest and other income (expense) net increased $3 million in 2006 compared to 2005.
The increase is due primarily to higher interest income on temporary cash investments, and the deferred fuel assets in Texas.
Interest and other income (expense) net decreased $8 million in 2005 compared with 2004. The decrease is due to interest income
related to the finalization of prior-period IRS audits of $11 million in 2004, partially offset by a $2 million gain on the sale of water
rights in 2005.
Interest and Financing Costs — Interest charges increased by approximately $24 million, or 5.1 percent, for 2006 compared with
2005. The increase is due to higher levels of both short-term and long-term debt and higher short-term interest rates.
The 2005 interest charges and financing costs increased approximately $8 million, or 1.9 percent, when compared with 2004,
primarily due to increased short term borrowing levels.
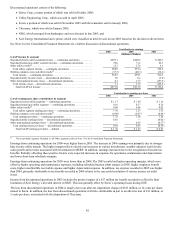
Income Tax Expense — Income taxes for continuing operations increased by $8 million for 2006, compared with 2005. The effective
tax rate for continuing operations was 24.2 percent for 2006, compared with 25.8 percent for 2005. The increase in income tax
expense was primarily due to an increase in pretax income, partially offset by $30 million of tax benefits from the reversal of a
regulatory reserve and realized capital loss carryforwards. Without these tax benefits the effective tax rate for 2006 would have been
28.2 percent.
The effective income tax rate for continuing operations was 25.8 percent for 2005, compared with 23.7 percent in 2004. Income taxes
recorded in 2005 reflect tax benefits of $10 million, primarily from increased research credits and a net operating loss carry back.
Excluding the tax benefits, the effective rate for 2005 would have been 27.3 percent.
See Note 7 to the Consolidated Financial Statements.
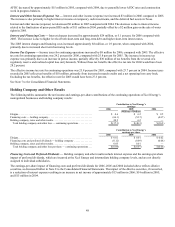
Holding Company and Other Results
The following tables summarize the net income and earnings-per-share contributions of the continuing operations of Xcel Energy’s
nonregulated businesses and holding company results:
Contribution to Xcel Energy’s
earnings
2006 2005 2004
(Millions of Dollars)
Eloigne......................................................... $ 4.6 $ 6.2 $ 8.5
Financing costs — holding company.................................. (66.1) (52.7) (44.7)
Holding company, taxes and other results.............................. 24.2 6.2
—
Total holding company and other loss — continuing operations........... $ (37.3) $ (40.3) $ (36.2)
Contribution to Xcel Energy’s
earnings per share
2006 2005 2004
Eloigne......................................................... $ 0.01 $ 0.01 $ 0.02
Financing costs and preferred dividends — holding company .............. (0.12) (0.09) (0.08)
Holding company, taxes and other results.............................. 0.05 0.01
—
Total holding company and other loss per share — continuing operations . . . $ (0.06) $ (0.07 ) $ (0.06 )
Financing Costs and Preferred Dividends — Holding company and other results include interest expense and the earnings-per-share
impact of preferred dividends, which are incurred at the Xcel Energy and intermediate holding company levels, and are not directly
assigned to individual subsidiaries.
The earnings-per-share impact of financing costs and preferred dividends for 2006, 2005 and 2004 included above reflects dilutive
securities, as discussed further in Note 8 to the Consolidated Financial Statements. The impact of the dilutive securities, if converted,
is a reduction of interest expense resulting in an increase in net income of approximately $15 million in 2006; $14 million in 2005;
and $15 million in 2004.