Xcel Energy 2006 Annual Report Download - page 48
Download and view the complete annual report
Please find page 48 of the 2006 Xcel Energy annual report below. You can navigate through the pages in the report by either clicking on the pages listed below, or by using the keyword search tool below to find specific information within the annual report.-
 1
1 -
2
-
3
-
4
-
5
-
6
-
7
-
8
-
9
-
10
-
11
-
12
-
13
-
14
-
15
-
16
-
17
-
18
-
19
-
20
-
21
-
22
-
23
-
24
-
25
-
26
-
27
-
28
-
29
-
30
-
31
-
32
-
33
-
34
-
35
-
36
-
37
-
 38
38 -
 39
39 -
 40
40 -
 41
41 -
 42
42 -
 43
43 -
 44
44 -
 45
45 -
 46
46 -
 47
47 -
 48
48 -
 49
49 -
 50
50 -
 51
51 -
 52
52 -
 53
53 -
 54
54 -
 55
55 -
 56
56 -
 57
57 -
 58
58 -
59
-
60
-
61
-
62
-
63
-
64
-
65
-
66
-
67
-
68
-
69
-
70
-
71
-
72
-
73
-
74
-
75
-
76
-
77
-
78
-
79
-
80
-
81
-
82
-
83
-
84
-
85
-
86
-
87
-
88
-
89
-
90
-
91
-
92
-
93
-
94
-
95
-
96
-
97
-
98
-
99
-
100
-
101
-
102
-
103
-
104
-
105
-
106
-
107
-
108
-
109
-
110
-
111
-
112
-
113
-
114
-
115
-
116
-
117
-
118
-
119
-
120
-
121
-
122
-
123
-
124
-
125
-
126
-
127
-
128
-
129
-
130
-
131
-
132
-
133
-
134
-
135
-
136
-
137
-
138
-
139
-
140
-
141
-
142
-
143
-
144
-
145
-
146
-
147
-
148
-
149
-
150
-
151
-
152
-
153
-
154
-
155
-
156
 |
 |
38
High Low Dividends
2005
First Quarter........................ $18.41 $16.50 $0.2075
Second Quarter...................... $19.65 $16.83 $0.2150
Third Quarter....................... $20.19 $18.44 $0.2150
Fourth Quarter...................... $19.83 $17.81 $0.2150
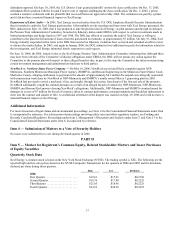
Book value per share at Dec. 31, 2006, was $14.28. The number of common shareholders of record as of Dec. 31, 2006 was 98,881.
Xcel Energy’s Restated Articles of Incorporation provide for certain restrictions on the payment of cash dividends on common stock.
At Dec. 31, 2006 and 2005, the payment of cash dividends on common stock was not restricted. For further discussion of Xcel
Energy’s dividend policy, see Liquidity and Capital Resources under Item 7.
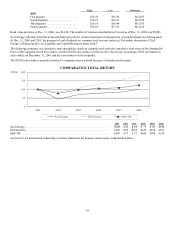
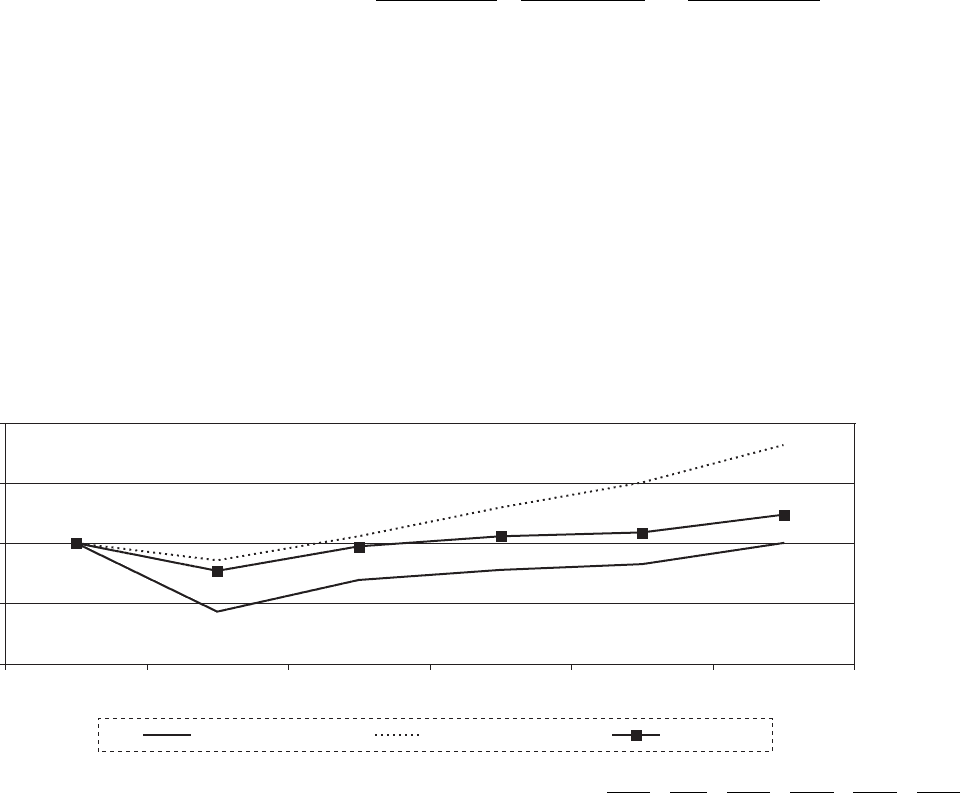
The following compares our cumulative total shareholder return on common stock with the cumulative total return of the Standard &
Poor’s 500 Composite Stock Price Index, and the EEI Electrics Index over the last five fiscal years (assuming a $100 investment in
each vehicle on December 31, 2001 and the reinvestment of all dividends).
The EEI Electrics Index currently includes 63 companies and is a broad measure of industry performance.
COMPARATIVE TOTAL RETURN
0
50
100
150
200
2001 2002 2003 2004 2005 2006
Dollars
Xcel Energy EEI Electrics S&P 500
2001 2002 2003 2004 2005 2006
Xcel Energy............................................................. $100 $ 43 $ 69 $ 77 $ 82 $100
EEI Electrics............................................................ $100 $ 85 $105 $129 $150 $181
S&P 500 ............................................................... $100 $ 77 $ 97 $106 $109 $124
See Item 12 for information concerning securities authorized for issuance under equity compensation plans.