Xcel Energy 2006 Annual Report Download - page 55
Download and view the complete annual report
Please find page 55 of the 2006 Xcel Energy annual report below. You can navigate through the pages in the report by either clicking on the pages listed below, or by using the keyword search tool below to find specific information within the annual report.-
 1
1 -
2
-
3
-
4
-
5
-
6
-
7
-
8
-
9
-
10
-
11
-
12
-
13
-
14
-
15
-
16
-
17
-
18
-
19
-
20
-
21
-
22
-
23
-
24
-
25
-
26
-
27
-
28
-
29
-
30
-
31
-
32
-
33
-
34
-
35
-
36
-
37
-
38
-
39
-
40
-
41
-
42
-
43
-
44
-
 45
45 -
 46
46 -
 47
47 -
 48
48 -
 49
49 -
 50
50 -
 51
51 -
 52
52 -
 53
53 -
 54
54 -
 55
55 -
 56
56 -
 57
57 -
 58
58 -
 59
59 -
 60
60 -
 61
61 -
 62
62 -
 63
63 -
 64
64 -
 65
65 -
66
-
67
-
68
-
69
-
70
-
71
-
72
-
73
-
74
-
75
-
76
-
77
-
78
-
79
-
80
-
81
-
82
-
83
-
84
-
85
-
86
-
87
-
88
-
89
-
90
-
91
-
92
-
93
-
94
-
95
-
96
-
97
-
98
-
99
-
100
-
101
-
102
-
103
-
104
-
105
-
106
-
107
-
108
-
109
-
110
-
111
-
112
-
113
-
114
-
115
-
116
-
117
-
118
-
119
-
120
-
121
-
122
-
123
-
124
-
125
-
126
-
127
-
128
-
129
-
130
-
131
-
132
-
133
-
134
-
135
-
136
-
137
-
138
-
139
-
140
-
141
-
142
-
143
-
144
-
145
-
146
-
147
-
148
-
149
-
150
-
151
-
152
-
153
-
154
-
155
-
156
 |
 |

45
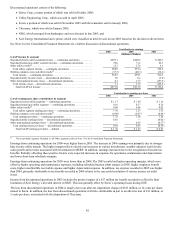
warmer than normal summer temperatures in 2005; higher revenues from firm wholesale customers and lower regulatory accruals
related to the Texas fuel reconciliation settlement.
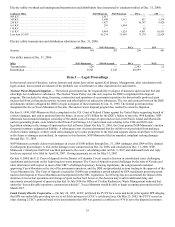
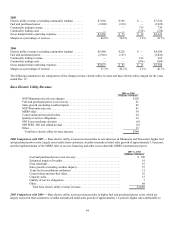
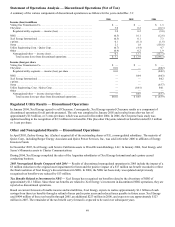
Base Electric Utility Margin
2006 vs. 2005
(Millions of Dollars)
NSP-Minnesota electric rate changes................................... $129
NSP-Wisconsin rate changes, including fuel and purchased power cost recovery 41
Sales growth (excluding weather impact)................................ 39
MERP rider........................................................ 38
Conservation and non-fuel rider revenue................................ 24
Firm wholesale..................................................... 12
Quality-of-service obligations ......................................... 12
Transmission fee classification change.................................. (26)
PSCo ECA incentive ................................................ (20)
SPS Texas surcharge decision ......................................... (8)
SPS FERC 206 rate refund accrual ..................................... (8)
Estimated impact of weather.......................................... (3)
Other, including certain regulatory reserves.............................. (4)
Total base electric utility margin increase.............................. $226
2006 Comparison to 2005 — Base electric utility margins, which are primarily derived from retail customer sales, increased due to
rate increases in Minnesota and Wisconsin, weather-normalized retail sales growth, the implementation of the MERP rider, and higher
firm wholesale margins. Partially offsetting the increase, is a transmission fee classification change from other operating and
maintenance expenses-utility in 2005 to electric utility margin in 2006, which did not impact operating income or net income. The
change resulted from an analysis conducted in conjunction with the expiration and renegotiation of certain transmission agreements,
resulting in better alignment of reporting such costs consistent with MISO classification. In addition, the ECA incentive earned in
Colorado in 2006 resulted in a loss, as compared to a gain in 2005.
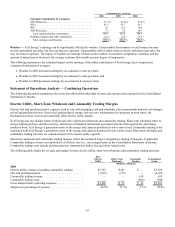
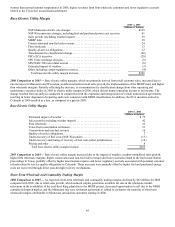
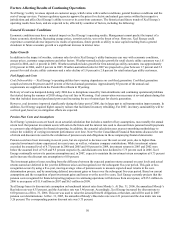
Base Electric Utility Margin
2005 vs. 2004
(Millions of Dollars)
Estimated impact of weather........................................... $ 75
Sales growth (excluding weather impact) ................................ 42
Firm wholesale...................................................... 23
Texas fuel reconciliation settlement..................................... 21
Conservation and non-fuel revenue ..................................... 16
Quality-of-service obligations.......................................... 7
Under-recovery of fuel costs (NSP-Wisconsin) ........................... (15)
Under-recovery and timing of recovery of fuel costs (other jurisdictions)...... (14)
Pricing and other.................................................... 8
Total base electric utility margin increase .............................. $163
2005 Comparison to 2004 — Base electric utility margin increased due to the impact of weather, weather-normalized sales growth,
higher firm wholesale margins, higher conservation and non-fuel rider revenues and lower accruals related to the fuel reconciliation
proceedings in Texas, partially offset by higher amortization expense and lower regulatory accruals associated with potential customer
refunds related to service-quality obligations in Colorado. These increases were partially offset by higher fuel and purchased energy
costs not recovered through direct pass-through recovery mechanisms.
Short-Term Wholesale and Commodity Trading Margin
2006 Comparison to 2005 — As expected, short-term wholesale and commodity trading margins declined by $43 million for 2006
compared with 2005, due to retail sales growth, which reduced surplus generation available for sale in the wholesale market,
reductions in the availability of the coal-fired King plant due to the MERP project, decreased opportunities to sell due to the MISO
centralized dispatch market, and the Minnesota rate case settlement agreement to refund to customers the majority of short-term
wholesale margins attributable to Minnesota jurisdiction customers starting in 2006.