Xcel Energy 2006 Annual Report Download - page 123
Download and view the complete annual report
Please find page 123 of the 2006 Xcel Energy annual report below. You can navigate through the pages in the report by either clicking on the pages listed below, or by using the keyword search tool below to find specific information within the annual report.-
 1
1 -
2
-
3
-
4
-
5
-
6
-
7
-
8
-
9
-
10
-
11
-
12
-
13
-
14
-
15
-
16
-
17
-
18
-
19
-
20
-
21
-
22
-
23
-
24
-
25
-
26
-
27
-
28
-
29
-
30
-
31
-
32
-
33
-
34
-
35
-
36
-
37
-
38
-
39
-
40
-
41
-
42
-
43
-
44
-
45
-
46
-
47
-
48
-
49
-
50
-
51
-
52
-
53
-
54
-
55
-
56
-
57
-
58
-
59
-
60
-
61
-
62
-
63
-
64
-
65
-
66
-
67
-
68
-
69
-
70
-
71
-
72
-
73
-
74
-
75
-
76
-
77
-
78
-
79
-
80
-
81
-
82
-
83
-
84
-
85
-
86
-
87
-
88
-
89
-
90
-
91
-
92
-
93
-
94
-
95
-
96
-
97
-
98
-
99
-
100
-
101
-
102
-
103
-
104
-
105
-
106
-
107
-
108
-
109
-
110
-
111
-
112
-
 113
113 -
 114
114 -
 115
115 -
 116
116 -
 117
117 -
 118
118 -
 119
119 -
 120
120 -
 121
121 -
 122
122 -
 123
123 -
 124
124 -
 125
125 -
 126
126 -
 127
127 -
 128
128 -
 129
129 -
 130
130 -
 131
131 -
 132
132 -
 133
133 -
134
-
135
-
136
-
137
-
138
-
139
-
140
-
141
-
142
-
143
-
144
-
145
-
146
-
147
-
148
-
149
-
150
-
151
-
152
-
153
-
154
-
155
-
156
 |
 |

113
approved in 2006 has been used for the regulatory presentation and all the updated parameters were used for the 2005 ARO layer for
SFAS No. 143 recognition.
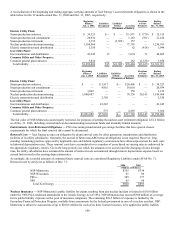
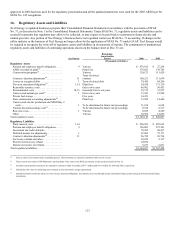
16. Regulatory Assets and Liabilities
Xcel Energy’s regulated businesses prepare their Consolidated Financial Statements in accordance with the provisions of SFAS
No. 71, as discussed in Note 1 to the Consolidated Financial Statements. Under SFAS No. 71, regulatory assets and liabilities can be
created for amounts that regulators may allow to be collected, or may require to be paid back to customers in future electric and
natural gas rates. Any portion of Xcel Energy’s business that is not regulated cannot use SFAS No. 71 accounting. If changes in the
utility industry or the business of Xcel Energy no longer allow for the application of SFAS No. 71 under GAAP, Xcel Energy would
be required to recognize the write-off of regulatory assets and liabilities in its statement of income. The components of unamortized
regulatory assets and liabilities of continuing operations shown on the balance sheet at Dec. 31 are:
See Note(s)
Remaining
Amortization
Period 2006 2005
(Thousands of Dollars)
Regulatory Assets
Pension and employee benefit obligations..... 9 Various $ 475,815 $ 27,234
AFDC recorded in plant(a) ................. Plant lives 179,023 170,785
Conservation programs(a) .................. Various 124,123 111,429
Term of related
Contract valuation adjustments(d)............ 11 contract 109,221 111,639
Losses on reacquired debt................. 1 Term of related debt 74,420 84,290
Net asset retirement obligations(e) ........... 1,14 Plant lives 54,550 171,170
Renewable resource costs ................. One to two years 49,902 50,453
Environmental costs ..................... 14,15 Generally four to six years 35,715 33,957
Unrecovered natural gas costs(c) ............ 1 One to two years 17,943 12,998
Private fuel storage ...................... Five years 14,473 —
State commission accounting adjustments(a) . . . Plant lives 13,950 14,460
Unrecovered electric production and MISO Day 2
costs................................ 1 To be determined in future rate proceedings 11,014 6,634
Nuclear decommissioning costs(b) ........... To be determined in future rate proceedings 9,325 8,317
Rate case costs.......................... 1 Various 8,689 4,549
Other................................. Various 10,982 12,092
Total regulatory assets...................... $ 1,189,145 $ 820,007
Regulatory Liabilities
Plant removal costs...................... 1,14 $ 920,583 $ 895,653
Pension and employee benefit obligations..... 9 196,803 397,261
Investment tax credit deferrals.............. 78,205 84,437
Deferred income tax adjustments............ 1 67,002 75,171
Contract valuation adjustments(d)............ 11 56,745 99,734
Fuel costs, refunds and other............... 30,032 9,137
Electric fuel recovery refund............... 10,054 —
Interest on income tax refunds.............. 5,233 6,031
Total regulatory liabilities................... $ 1,364,657 $ 1,567,424
(a) Earns a return on investment in the ratemaking process. These amounts are amortized consistent with recovery in rates.
(b) These costs do not relate to NSP-Minnesota’s nuclear plants. They relate to the DOE assessments, as discussed previously in Note 15.
(c) Excludes current portion expected to be returned to customers within 12 months of $17.7 million and $16.3 million for 2006 and 2005, respectively.
(d) Includes the fair value of certain long-term contracts used to meet native energy requirements.
(e) Includes amounts recorded for future recovery of asset retirement obligations, less amounts recovered through nuclear decommissioning accruals and gains from decommissioning
investments.