Western Union 2013 Annual Report Download - page 75
Download and view the complete annual report
Please find page 75 of the 2013 Western Union annual report below. You can navigate through the pages in the report by either clicking on the pages listed below, or by using the keyword search tool below to find specific information within the annual report.-
 1
1 -
2
-
3
-
4
-
5
-
6
-
7
-
8
-
9
-
10
-
11
-
12
-
13
-
14
-
15
-
16
-
17
-
18
-
19
-
20
-
21
-
22
-
23
-
24
-
25
-
26
-
27
-
28
-
29
-
30
-
31
-
32
-
33
-
34
-
35
-
36
-
37
-
38
-
39
-
40
-
41
-
42
-
43
-
44
-
45
-
46
-
47
-
48
-
49
-
50
-
51
-
52
-
53
-
54
-
55
-
56
-
57
-
58
-
59
-
60
-
61
-
62
-
63
-
64
-
 65
65 -
 66
66 -
 67
67 -
 68
68 -
 69
69 -
 70
70 -
 71
71 -
 72
72 -
 73
73 -
 74
74 -
 75
75 -
 76
76 -
 77
77 -
 78
78 -
 79
79 -
 80
80 -
 81
81 -
 82
82 -
 83
83 -
 84
84 -
 85
85 -
86
-
87
-
88
-
89
-
90
-
91
-
92
-
93
-
94
-
95
-
96
-
97
-
98
-
99
-
100
-
101
-
102
-
103
-
104
-
105
-
106
-
107
-
108
-
109
-
110
-
111
-
112
-
113
-
114
-
115
-
116
-
117
-
118
-
119
-
120
-
121
-
122
-
123
-
124
-
125
-
126
-
127
-
128
-
129
-
130
-
131
-
132
-
133
-
134
-
135
-
136
-
137
-
138
-
139
-
140
-
141
-
142
-
143
-
144
-
145
-
146
-
147
-
148
-
149
-
150
-
151
-
152
-
153
-
154
-
155
-
156
-
157
-
158
-
159
-
160
-
161
-
162
-
163
-
164
-
165
-
166
-
167
-
168
-
169
-
170
-
171
-
172
-
173
-
174
-
175
-
176
-
177
-
178
-
179
-
180
-
181
-
182
-
183
-
184
-
185
-
186
-
187
-
188
-
189
-
190
-
191
-
192
-
193
-
194
-
195
-
196
-
197
-
198
-
199
-
200
-
201
-
202
-
203
-
204
-
205
-
206
-
207
-
208
-
209
-
210
-
211
-
212
-
213
-
214
-
215
-
216
-
217
-
218
-
219
-
220
-
221
-
222
-
223
-
224
-
225
-
226
-
227
-
228
-
229
-
230
-
231
-
232
-
233
-
234
-
235
-
236
-
237
-
238
-
239
-
240
-
241
-
242
-
243
-
244
-
245
-
246
-
247
-
248
-
249
-
250
-
251
-
252
-
253
-
254
-
255
-
256
-
257
-
258
-
259
-
260
-
261
-
262
-
263
-
264
-
265
-
266
-
267
-
268
-
269
-
270
-
271
-
272
-
273
-
274
 |
 |

57 | The Western Union Company – Proxy Statement
NOTICE OF 2014 ANNUAL MEETING OF STOCKHOLDERS AND PROXY STATEMENT
Executive Compensation PROXY STATEMENT
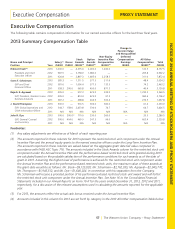
Executive Compensation
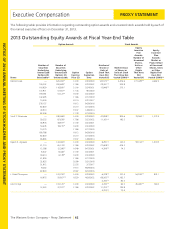
The following table contains compensation information for our named executive officers for the last three fiscal years.
2013 Summary Compensation Table
Name and Principal
Position Year
Salary(1)
($000)
Bonus
($000)
Stock
Awards
($000)(2)
Option
Awards
($000)(2)
Non-Equity
Incentive Plan
Compensation
($000)(3)
Change in
Pension Value
and Nonqualified
Deferred
Compensation
Earnings
($000)
All Other
Compensation
($000)(4)
Total
($000)
Hikmet Ersek(5) 2013 1,000.0 — 4,375.0 2,000.0 1,260.0 — 122.5 8,757.5
President and Chief
Executive Officer
2012 987.5 — 3,758.9 1,980.0 — — 265.8 6,992.2
2011 920.8 — 2,897.3 1,485.0 2,258.3 — 311.0 7,872.4
Scott T. Scheirman 2013 585.3 — 1,311.5 577.5 511.6 — 48.4 3,034.3
EVP and Chief
Financial Officer
2012 581.6 — 1,096.4 577.5 133.5 — 74.2 2,463.2
2011 558.3 200.0 965.8 495.0 871.3 — 40.4 3,130.8
Rajesh K. Agrawal 2013 405.0 — 972.3 429.0 324.0 — 1,230.2 3,360.5
EVP, President, Western Union
Business Solutions
2012 405.0 — 814.4 429.0 97.2 — 960.6 2,706.2
2011 387.2 — 498.8 204.9 300.4 — 276.5 1,667.8
J. David Thompson 2013 500.0 — 916.5 396.0 360.0 — 61.4 2,233.9
EVP, Global Operations and
Chief Information Officer
2012 344.7 158.6 2,453.8 330.0 74.7 — 64.7 3,426.5
2011 N/A N/A N/A N/A N/A N/A N/A N/A
John R. Dye 2013 500.0 300.0(6) 770.0 330.0 360.0 — 20.5 2,280.5
EVP, General Counsel
and Secretary
2012 500.0 404.0 469.9 247.5 96.0 — 603.4 2,320.8
2011 N/A N/A N/A N/A N/A N/A N/A N/A
Footnotes:
(1) Any salary adjustments are effective as of March of each reporting year.
(2) The amounts reported in these columns for 2013 represent the restricted stock unit component under the Annual
Incentive Plan and the annual equity grants to the named executive officers under the Long-Term Incentive Plan.
The amounts reported in these columns are valued based on the aggregate grant date fair value computed in
accordance with FASB ASC Topic 718. The amounts included in the Stock Awards column for the restricted stock unit
component under the Annual Incentive Plan and the performance-based restricted stock units granted during 2013
are calculated based on the probable satisfaction of the performance conditions for such awards as of the date of
grant in 2013. Assuming the highest level of performance is achieved for the restricted stock unit component under
the Annual Incentive Plan and the performance-based restricted stock units, the maximum value of these awards at
the grant date would be as follows: Mr. Ersek—$9,125,020; Mr. Scheirman—$2,762,035; Mr. Agrawal—$2,045,770;
Mr. Thompson—$1,945,512; and Mr. Dye—$1,640,024. In connection with his separation from the Company,
Mr. Scheirman will receive a prorated portion of his performance-based restricted stock unit award and will forfeit
the restricted stock unit component under the Annual Incentive Plan. See Note 16 to the Consolidated Financial
Statements included in our Annual Reports on Form 10-K for the years ended December 31, 2013, 2012 and 2011,
respectively, for a discussion of the relevant assumptions used in calculating the amounts reported for the applicable
year.
(3) For 2013, the amounts reflect the actual cash bonus received under the Annual Incentive Plan.
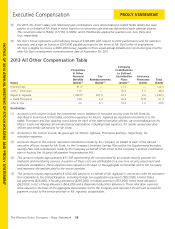
(4) Amounts included in this column for 2013 are set forth by category in the 2013 All Other Compensation Table below.