Western Union 2013 Annual Report Download - page 62
Download and view the complete annual report
Please find page 62 of the 2013 Western Union annual report below. You can navigate through the pages in the report by either clicking on the pages listed below, or by using the keyword search tool below to find specific information within the annual report.-
 1
1 -
2
-
3
-
4
-
5
-
6
-
7
-
8
-
9
-
10
-
11
-
12
-
13
-
14
-
15
-
16
-
17
-
18
-
19
-
20
-
21
-
22
-
23
-
24
-
25
-
26
-
27
-
28
-
29
-
30
-
31
-
32
-
33
-
34
-
35
-
36
-
37
-
38
-
39
-
40
-
41
-
42
-
43
-
44
-
45
-
46
-
47
-
48
-
49
-
50
-
51
-
 52
52 -
 53
53 -
 54
54 -
 55
55 -
 56
56 -
 57
57 -
 58
58 -
 59
59 -
 60
60 -
 61
61 -
 62
62 -
 63
63 -
 64
64 -
 65
65 -
 66
66 -
 67
67 -
 68
68 -
 69
69 -
 70
70 -
 71
71 -
 72
72 -
73
-
74
-
75
-
76
-
77
-
78
-
79
-
80
-
81
-
82
-
83
-
84
-
85
-
86
-
87
-
88
-
89
-
90
-
91
-
92
-
93
-
94
-
95
-
96
-
97
-
98
-
99
-
100
-
101
-
102
-
103
-
104
-
105
-
106
-
107
-
108
-
109
-
110
-
111
-
112
-
113
-
114
-
115
-
116
-
117
-
118
-
119
-
120
-
121
-
122
-
123
-
124
-
125
-
126
-
127
-
128
-
129
-
130
-
131
-
132
-
133
-
134
-
135
-
136
-
137
-
138
-
139
-
140
-
141
-
142
-
143
-
144
-
145
-
146
-
147
-
148
-
149
-
150
-
151
-
152
-
153
-
154
-
155
-
156
-
157
-
158
-
159
-
160
-
161
-
162
-
163
-
164
-
165
-
166
-
167
-
168
-
169
-
170
-
171
-
172
-
173
-
174
-
175
-
176
-
177
-
178
-
179
-
180
-
181
-
182
-
183
-
184
-
185
-
186
-
187
-
188
-
189
-
190
-
191
-
192
-
193
-
194
-
195
-
196
-
197
-
198
-
199
-
200
-
201
-
202
-
203
-
204
-
205
-
206
-
207
-
208
-
209
-
210
-
211
-
212
-
213
-
214
-
215
-
216
-
217
-
218
-
219
-
220
-
221
-
222
-
223
-
224
-
225
-
226
-
227
-
228
-
229
-
230
-
231
-
232
-
233
-
234
-
235
-
236
-
237
-
238
-
239
-
240
-
241
-
242
-
243
-
244
-
245
-
246
-
247
-
248
-
249
-
250
-
251
-
252
-
253
-
254
-
255
-
256
-
257
-
258
-
259
-
260
-
261
-
262
-
263
-
264
-
265
-
266
-
267
-
268
-
269
-
270
-
271
-
272
-
273
-
274
 |
 |

Compensation Discussion and Analysis PROXY STATEMENT
The Western Union Company – Proxy Statement | 44
NOTICE OF 2014 ANNUAL MEETING OF STOCKHOLDERS AND PROXY STATEMENT
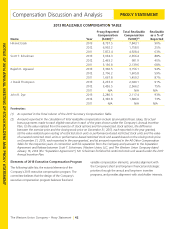
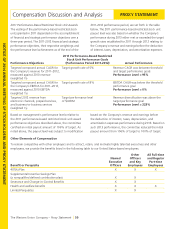
Element Key Characteristics
Why We Pay
This Element
How We
Determine Amount 2013 Decisions
Performance-
based restricted
stock units
Performance-based
restricted stock units vest
based on the Company’s
achievement of financial
performance objectives
and are subject to a
relative TSR performance
measure.
Coupled with stock
options, aligns the
interests of executives
with those of our
stockholders by focusing
the executives on long-
term objectives over a
multi-year period.
Hold our executives
accountable, with
payouts varying from
target based on
actual performance
against pre-established
and communicated
performance goals.
Company performance
on financial measures
over 2013-2014
performance period:
- 2013 revenue and
operating income
compared to 2013 Plan;
and
- 2014 revenue and
operating income growth
compared to 2013.
Payout subject to a
+/- modifier based on
the Company’s TSR
performance relative
to the TSR of the
S&P 500 Index over
2013-2015.
Performance-based
restricted stock units
represent 67% of the
long-term grant value,
reflecting the Company’s
emphasis on tying long-
term incentive awards to
the Company’s financial
and TSR performance.
See pages 47-50
and 53-56.
Stock options Nonqualified stock
options that expire ten
years after grant and
become exercisable in
25% annual increments
over a four-year
vesting period.
Coupled with
performance-based
restricted stock units,
aligns the interests of
executives with those
of our stockholders by
focusing the executives
on long-term objectives
over a multi-year
period, including stock
price growth.
Market practice and
individual performance.
Stock options represent
33% of the long-term
grant value, reflecting
the Company’s emphasis
on tying long-term
incentive awards to the
Company’s stock price.
See pages 47-48.
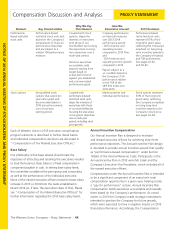
Each of Western Union’s 2013 executive compensation
program elements is described in further detail below
and individual compensation decisions are discussed in
“-Compensation of Our Named Executive Officers.”
Base Salary
Our philosophy is that base salaries should meet the
objectives of attracting and retaining the executives needed
to lead the business. Base salary is a fixed compensation
component payable in cash. In setting base salary levels,
the committee considered the peer group and survey data
as well as the performance of the individual executive.
None of the named executive officers received a base salary
increase in 2013 or 2014 from the levels established in
March 2012 (or, if later, the executive’s date of hire). Please
see “-Compensation of Our Named Executive Officers” for
further information regarding the 2013 base salary levels.
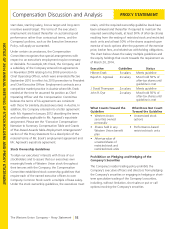
Annual Incentive Compensation
Our Annual Incentive Plan is designed to motivate
and reward executive officers for achieving short-term
performance objectives. The Annual Incentive Plan design
is intended to provide annual incentive awards that qualify
as “performance-based compensation” under Section
162(m) of the Internal Revenue Code. Participants in the
Annual Incentive Plan in 2013 were Mr. Ersek and the
Company’s Executive Vice Presidents, which included all of
the named executive officers.
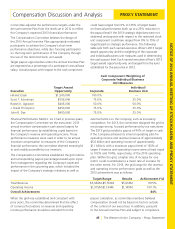
Compensation under the Annual Incentive Plan is intended
to be a significant component of an executive’s total
compensation opportunity in a given year, helping create
a “pay for performance” culture. Annual Incentive Plan
compensation holds executives accountable and rewards
them based on the Company’s performance. As noted
earlier, in 2013 the Company made strategic investments
intended to position the Company for future growth,
which were expected to have a negative impact on 2013
financial performance. Accordingly, the Compensation