Western Union 2013 Annual Report Download - page 169
Download and view the complete annual report
Please find page 169 of the 2013 Western Union annual report below. You can navigate through the pages in the report by either clicking on the pages listed below, or by using the keyword search tool below to find specific information within the annual report.-
 1
1 -
2
-
3
-
4
-
5
-
6
-
7
-
8
-
9
-
10
-
11
-
12
-
13
-
14
-
15
-
16
-
17
-
18
-
19
-
20
-
21
-
22
-
23
-
24
-
25
-
26
-
27
-
28
-
29
-
30
-
31
-
32
-
33
-
34
-
35
-
36
-
37
-
38
-
39
-
40
-
41
-
42
-
43
-
44
-
45
-
46
-
47
-
48
-
49
-
50
-
51
-
52
-
53
-
54
-
55
-
56
-
57
-
58
-
59
-
60
-
61
-
62
-
63
-
64
-
65
-
66
-
67
-
68
-
69
-
70
-
71
-
72
-
73
-
74
-
75
-
76
-
77
-
78
-
79
-
80
-
81
-
82
-
83
-
84
-
85
-
86
-
87
-
88
-
89
-
90
-
91
-
92
-
93
-
94
-
95
-
96
-
97
-
98
-
99
-
100
-
101
-
102
-
103
-
104
-
105
-
106
-
107
-
108
-
109
-
110
-
111
-
112
-
113
-
114
-
115
-
116
-
117
-
118
-
119
-
120
-
121
-
122
-
123
-
124
-
125
-
126
-
127
-
128
-
129
-
130
-
131
-
132
-
133
-
134
-
135
-
136
-
137
-
138
-
139
-
140
-
141
-
142
-
143
-
144
-
145
-
146
-
147
-
148
-
149
-
150
-
151
-
152
-
153
-
154
-
155
-
156
-
157
-
158
-
 159
159 -
 160
160 -
 161
161 -
 162
162 -
 163
163 -
 164
164 -
 165
165 -
 166
166 -
 167
167 -
 168
168 -
 169
169 -
 170
170 -
 171
171 -
 172
172 -
 173
173 -
 174
174 -
 175
175 -
 176
176 -
 177
177 -
 178
178 -
 179
179 -
180
-
181
-
182
-
183
-
184
-
185
-
186
-
187
-
188
-
189
-
190
-
191
-
192
-
193
-
194
-
195
-
196
-
197
-
198
-
199
-
200
-
201
-
202
-
203
-
204
-
205
-
206
-
207
-
208
-
209
-
210
-
211
-
212
-
213
-
214
-
215
-
216
-
217
-
218
-
219
-
220
-
221
-
222
-
223
-
224
-
225
-
226
-
227
-
228
-
229
-
230
-
231
-
232
-
233
-
234
-
235
-
236
-
237
-
238
-
239
-
240
-
241
-
242
-
243
-
244
-
245
-
246
-
247
-
248
-
249
-
250
-
251
-
252
-
253
-
254
-
255
-
256
-
257
-
258
-
259
-
260
-
261
-
262
-
263
-
264
-
265
-
266
-
267
-
268
-
269
-
270
-
271
-
272
-
273
-
274
 |
 |

2013 FORM 10-K
59
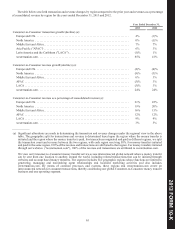
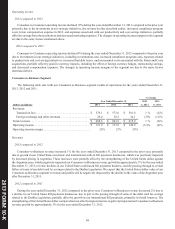
Revenues overview
Transaction volume is the primary generator of revenue in our businesses. Transaction fees are fees that consumers pay when
they send money or make payments. Consumer-to-Consumer transaction fees generally vary according to the principal amount of
the money transfer and the locations from and to which the funds are sent and received. Additionally, in certain consumer money
transfer and Business Solutions transactions involving different send and receive currencies, we generate foreign exchange revenues
based on the difference between the exchange rate set by us to the consumer or business and the rate at which we or our agents
are able to acquire the currency. In our Consumer-to-Consumer business, foreign exchange revenue is primarily driven by
international Consumer-to-Consumer cross-currency transactions. The majority of transaction fees and foreign exchange revenues
were contributed by our Consumer-to-Consumer segment for all periods presented, which is discussed in greater detail in "Segment
Discussion."
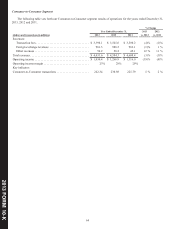
2013 compared to 2012
Consolidated revenue decreased 2% during the year ended December 31, 2013 compared to 2012. This decrease was caused
by our Consumer-to-Consumer segment, primarily due to price reductions in key corridors and the impact of compliance related
actions in various corridors (see "Enhanced Regulatory Compliance" described below), partially offset by Consumer-to-Consumer
transaction growth. The strengthening of the United States dollar compared to most other foreign currencies negatively impacted
revenue growth by approximately 1% in the year ended December 31, 2013.
Foreign exchange revenues increased for the year ended December 31, 2013 compared to 2012 primarily due to growth in
our Business Solutions segment and increased amounts of cross-border principal sent in our Consumer-to-Consumer segment,
partially offset by price reductions in certain corridors in our Consumer-to-Consumer segment.
Fluctuations in the exchange rate between the United States dollar and other currencies have resulted in a reduction to transaction
fees and foreign exchange revenues for the year ended December 31, 2013 of $70.3 million over the previous year, net of foreign
currency hedges, that would not have occurred had there been constant currency rates.
2012 compared to 2011
Consolidated revenue increased 3% during the year ended December 31, 2012 due to the acquisition of TGBP, which
contributed approximately 4% to consolidated revenue growth for the period, and Consumer-to-Consumer transaction growth of
2%, partially offset by the strengthening of the United States dollar compared to most other foreign currencies and slight price
reductions. The strengthening of the United States dollar compared to most other foreign currencies negatively impacted revenue
growth by approximately 2% in the year ended December 31, 2012.
Foreign exchange revenues increased for the year ended December 31, 2012 compared to 2011 primarily due to the acquisition
of TGBP.
Fluctuations in the exchange rate between the United States dollar and other currencies resulted in a reduction to transaction
fees and foreign exchange revenues for the year ended December 31, 2012 of $93.8 million over the previous year, net of foreign
currency hedges, that would not have occurred had there been constant currency rates.