Western Union 2013 Annual Report Download - page 174
Download and view the complete annual report
Please find page 174 of the 2013 Western Union annual report below. You can navigate through the pages in the report by either clicking on the pages listed below, or by using the keyword search tool below to find specific information within the annual report.-
 1
1 -
2
-
3
-
4
-
5
-
6
-
7
-
8
-
9
-
10
-
11
-
12
-
13
-
14
-
15
-
16
-
17
-
18
-
19
-
20
-
21
-
22
-
23
-
24
-
25
-
26
-
27
-
28
-
29
-
30
-
31
-
32
-
33
-
34
-
35
-
36
-
37
-
38
-
39
-
40
-
41
-
42
-
43
-
44
-
45
-
46
-
47
-
48
-
49
-
50
-
51
-
52
-
53
-
54
-
55
-
56
-
57
-
58
-
59
-
60
-
61
-
62
-
63
-
64
-
65
-
66
-
67
-
68
-
69
-
70
-
71
-
72
-
73
-
74
-
75
-
76
-
77
-
78
-
79
-
80
-
81
-
82
-
83
-
84
-
85
-
86
-
87
-
88
-
89
-
90
-
91
-
92
-
93
-
94
-
95
-
96
-
97
-
98
-
99
-
100
-
101
-
102
-
103
-
104
-
105
-
106
-
107
-
108
-
109
-
110
-
111
-
112
-
113
-
114
-
115
-
116
-
117
-
118
-
119
-
120
-
121
-
122
-
123
-
124
-
125
-
126
-
127
-
128
-
129
-
130
-
131
-
132
-
133
-
134
-
135
-
136
-
137
-
138
-
139
-
140
-
141
-
142
-
143
-
144
-
145
-
146
-
147
-
148
-
149
-
150
-
151
-
152
-
153
-
154
-
155
-
156
-
157
-
158
-
159
-
160
-
161
-
162
-
163
-
 164
164 -
 165
165 -
 166
166 -
 167
167 -
 168
168 -
 169
169 -
 170
170 -
 171
171 -
 172
172 -
 173
173 -
 174
174 -
 175
175 -
 176
176 -
 177
177 -
 178
178 -
 179
179 -
 180
180 -
 181
181 -
 182
182 -
 183
183 -
 184
184 -
185
-
186
-
187
-
188
-
189
-
190
-
191
-
192
-
193
-
194
-
195
-
196
-
197
-
198
-
199
-
200
-
201
-
202
-
203
-
204
-
205
-
206
-
207
-
208
-
209
-
210
-
211
-
212
-
213
-
214
-
215
-
216
-
217
-
218
-
219
-
220
-
221
-
222
-
223
-
224
-
225
-
226
-
227
-
228
-
229
-
230
-
231
-
232
-
233
-
234
-
235
-
236
-
237
-
238
-
239
-
240
-
241
-
242
-
243
-
244
-
245
-
246
-
247
-
248
-
249
-
250
-
251
-
252
-
253
-
254
-
255
-
256
-
257
-
258
-
259
-
260
-
261
-
262
-
263
-
264
-
265
-
266
-
267
-
268
-
269
-
270
-
271
-
272
-
273
-
274
 |
 |

2013 FORM 10-K
64
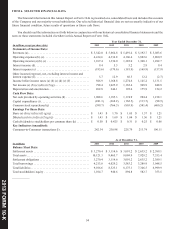
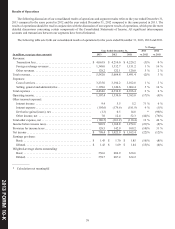
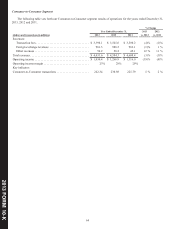
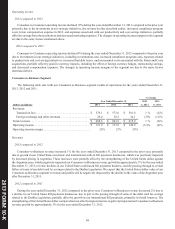
Consumer-to-Consumer Segment
The following table sets forth our Consumer-to-Consumer segment results of operations for the years ended December 31,
2013, 2012 and 2011.
% Change
Year Ended December 31, 2013 2012
(dollars and transactions in millions) 2013 2012 2011 vs. 2012 vs. 2011
Revenues:
Transaction fees . . . . . . . . . . . . . . . . . . . . . . . . . . . . . . . . . . . . $ 3,396.1 $ 3,545.6 $ 3,580.2 (4)% (1)%
Foreign exchange revenues . . . . . . . . . . . . . . . . . . . . . . . . . . . 981.3 988.5 983.1 (1)% 1 %
Other revenues . . . . . . . . . . . . . . . . . . . . . . . . . . . . . . . . . . . . . 56.2 50.2 45.1 12 % 11 %
Total revenues . . . . . . . . . . . . . . . . . . . . . . . . . . . . . . . . . . . . . . . . $ 4,433.6 $ 4,584.3 $ 4,608.4 (3)% (1)%
Operating income . . . . . . . . . . . . . . . . . . . . . . . . . . . . . . . . . . . . . $ 1,030.4 $ 1,266.9 $ 1,316.0 (19)% (4)%
Operating income margin . . . . . . . . . . . . . . . . . . . . . . . . . . . . . . . 23% 28% 29%
Key indicator:
Consumer-to-Consumer transactions . . . . . . . . . . . . . . . . . . . . . . 242.34 230.98 225.79 5 % 2 %