Western Union 2013 Annual Report Download - page 212
Download and view the complete annual report
Please find page 212 of the 2013 Western Union annual report below. You can navigate through the pages in the report by either clicking on the pages listed below, or by using the keyword search tool below to find specific information within the annual report.-
 1
1 -
2
-
3
-
4
-
5
-
6
-
7
-
8
-
9
-
10
-
11
-
12
-
13
-
14
-
15
-
16
-
17
-
18
-
19
-
20
-
21
-
22
-
23
-
24
-
25
-
26
-
27
-
28
-
29
-
30
-
31
-
32
-
33
-
34
-
35
-
36
-
37
-
38
-
39
-
40
-
41
-
42
-
43
-
44
-
45
-
46
-
47
-
48
-
49
-
50
-
51
-
52
-
53
-
54
-
55
-
56
-
57
-
58
-
59
-
60
-
61
-
62
-
63
-
64
-
65
-
66
-
67
-
68
-
69
-
70
-
71
-
72
-
73
-
74
-
75
-
76
-
77
-
78
-
79
-
80
-
81
-
82
-
83
-
84
-
85
-
86
-
87
-
88
-
89
-
90
-
91
-
92
-
93
-
94
-
95
-
96
-
97
-
98
-
99
-
100
-
101
-
102
-
103
-
104
-
105
-
106
-
107
-
108
-
109
-
110
-
111
-
112
-
113
-
114
-
115
-
116
-
117
-
118
-
119
-
120
-
121
-
122
-
123
-
124
-
125
-
126
-
127
-
128
-
129
-
130
-
131
-
132
-
133
-
134
-
135
-
136
-
137
-
138
-
139
-
140
-
141
-
142
-
143
-
144
-
145
-
146
-
147
-
148
-
149
-
150
-
151
-
152
-
153
-
154
-
155
-
156
-
157
-
158
-
159
-
160
-
161
-
162
-
163
-
164
-
165
-
166
-
167
-
168
-
169
-
170
-
171
-
172
-
173
-
174
-
175
-
176
-
177
-
178
-
179
-
180
-
181
-
182
-
183
-
184
-
185
-
186
-
187
-
188
-
189
-
190
-
191
-
192
-
193
-
194
-
195
-
196
-
197
-
198
-
199
-
200
-
201
-
 202
202 -
 203
203 -
 204
204 -
 205
205 -
 206
206 -
 207
207 -
 208
208 -
 209
209 -
 210
210 -
 211
211 -
 212
212 -
 213
213 -
 214
214 -
 215
215 -
 216
216 -
 217
217 -
 218
218 -
 219
219 -
 220
220 -
 221
221 -
 222
222 -
223
-
224
-
225
-
226
-
227
-
228
-
229
-
230
-
231
-
232
-
233
-
234
-
235
-
236
-
237
-
238
-
239
-
240
-
241
-
242
-
243
-
244
-
245
-
246
-
247
-
248
-
249
-
250
-
251
-
252
-
253
-
254
-
255
-
256
-
257
-
258
-
259
-
260
-
261
-
262
-
263
-
264
-
265
-
266
-
267
-
268
-
269
-
270
-
271
-
272
-
273
-
274
 |
 |

2013 FORM 10-K
THE WESTERN UNION COMPANY
NOTES TO CONSOLIDATED FINANCIAL STATEMENTS (Continued)
102
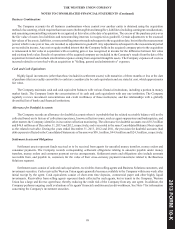
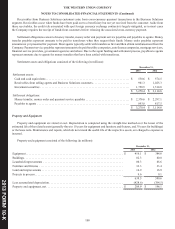
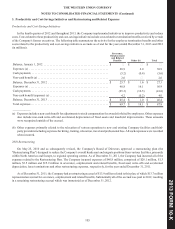
The estimated future aggregate amortization expense for existing other intangible assets as of December 31, 2013 is expected
to be $210.0 million in 2014, $151.0 million in 2015, $134.0 million in 2016, $102.5 million in 2017, $54.0 million in 2018 and
$182.3 million thereafter.
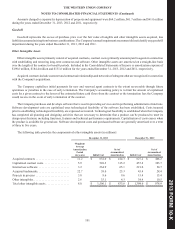
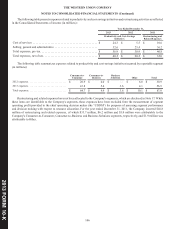
Other intangible assets are reviewed for impairment on an annual basis or whenever events or changes in circumstances
indicate that their carrying amount may not be recoverable. In such reviews, estimated undiscounted cash flows associated with
these assets or operations are compared with their carrying values to determine if a write-down to fair value (normally measured
by the present value technique) is required. The Company recorded immaterial impairments related to other intangible assets for
the year ended December 31, 2013 and did not record any impairment during the years ended December 31, 2012 and 2011.
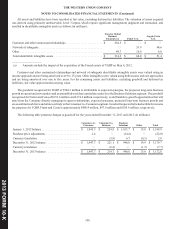
Revenue Recognition
The Company's revenues are primarily derived from consumer money transfer transaction fees that are based on the principal
amount of the money transfer and the locations from and to which funds are transferred. The Company also offers several global
payments services, including payments from consumers or businesses to other businesses. Transaction fees are set by the Company
and recorded as revenue at the time of sale.
In certain consumer money transfer and Business Solutions transactions involving different send and receive currencies, the
Company generates revenue based on the difference between the exchange rate set by the Company to the consumer or business
and the rate at which the Company or its agents are able to acquire the currency. This foreign exchange revenue is recorded at the
time the related consumer money transfer transaction fee revenue is recognized or at the time a customer initiates a transaction
through the Company's Business Solutions payment service operations.
Cost of Services
Cost of services primarily consists of agent commissions and expenses for call centers, settlement operations and related
information technology costs. Expenses within these functions include personnel, software, equipment, telecommunications, bank
fees, depreciation, amortization and other expenses incurred in connection with providing money transfer and other payment
services.
Advertising Costs
Advertising costs are charged to operating expenses as incurred. Advertising costs for the years ended December 31, 2013,
2012 and 2011 were $165.1 million, $177.5 million and $174.8 million, respectively.
Income Taxes
The Company accounts for income taxes under the liability method, which requires that deferred tax assets and liabilities be
determined based on the expected future income tax consequences of events that have been recognized in the consolidated financial
statements. Deferred tax assets and liabilities are recognized based on temporary differences between the financial statement
carrying amounts and tax bases of assets and liabilities using enacted tax rates in effect in the years in which the temporary
differences are expected to reverse. The Company assesses the realizability of its deferred tax assets. A valuation allowance must
be established when, based upon available evidence, it is more likely than not that all or a portion of the deferred tax assets will
not be realized.
The Company recognizes the tax benefits from uncertain tax positions only when it is more likely than not, based on the
technical merits of the position, the tax position will be sustained upon examination, including the resolution of any related appeals
or litigation. The tax benefits recognized in the consolidated financial statements from such a position are measured as the largest
benefit that has a greater than fifty percent likelihood of being realized upon ultimate resolution.
•
•
•