Western Union 2013 Annual Report Download - page 66
Download and view the complete annual report
Please find page 66 of the 2013 Western Union annual report below. You can navigate through the pages in the report by either clicking on the pages listed below, or by using the keyword search tool below to find specific information within the annual report.-
 1
1 -
2
-
3
-
4
-
5
-
6
-
7
-
8
-
9
-
10
-
11
-
12
-
13
-
14
-
15
-
16
-
17
-
18
-
19
-
20
-
21
-
22
-
23
-
24
-
25
-
26
-
27
-
28
-
29
-
30
-
31
-
32
-
33
-
34
-
35
-
36
-
37
-
38
-
39
-
40
-
41
-
42
-
43
-
44
-
45
-
46
-
47
-
48
-
49
-
50
-
51
-
52
-
53
-
54
-
55
-
 56
56 -
 57
57 -
 58
58 -
 59
59 -
 60
60 -
 61
61 -
 62
62 -
 63
63 -
 64
64 -
 65
65 -
 66
66 -
 67
67 -
 68
68 -
 69
69 -
 70
70 -
 71
71 -
 72
72 -
 73
73 -
 74
74 -
 75
75 -
 76
76 -
77
-
78
-
79
-
80
-
81
-
82
-
83
-
84
-
85
-
86
-
87
-
88
-
89
-
90
-
91
-
92
-
93
-
94
-
95
-
96
-
97
-
98
-
99
-
100
-
101
-
102
-
103
-
104
-
105
-
106
-
107
-
108
-
109
-
110
-
111
-
112
-
113
-
114
-
115
-
116
-
117
-
118
-
119
-
120
-
121
-
122
-
123
-
124
-
125
-
126
-
127
-
128
-
129
-
130
-
131
-
132
-
133
-
134
-
135
-
136
-
137
-
138
-
139
-
140
-
141
-
142
-
143
-
144
-
145
-
146
-
147
-
148
-
149
-
150
-
151
-
152
-
153
-
154
-
155
-
156
-
157
-
158
-
159
-
160
-
161
-
162
-
163
-
164
-
165
-
166
-
167
-
168
-
169
-
170
-
171
-
172
-
173
-
174
-
175
-
176
-
177
-
178
-
179
-
180
-
181
-
182
-
183
-
184
-
185
-
186
-
187
-
188
-
189
-
190
-
191
-
192
-
193
-
194
-
195
-
196
-
197
-
198
-
199
-
200
-
201
-
202
-
203
-
204
-
205
-
206
-
207
-
208
-
209
-
210
-
211
-
212
-
213
-
214
-
215
-
216
-
217
-
218
-
219
-
220
-
221
-
222
-
223
-
224
-
225
-
226
-
227
-
228
-
229
-
230
-
231
-
232
-
233
-
234
-
235
-
236
-
237
-
238
-
239
-
240
-
241
-
242
-
243
-
244
-
245
-
246
-
247
-
248
-
249
-
250
-
251
-
252
-
253
-
254
-
255
-
256
-
257
-
258
-
259
-
260
-
261
-
262
-
263
-
264
-
265
-
266
-
267
-
268
-
269
-
270
-
271
-
272
-
273
-
274
 |
 |

Compensation Discussion and Analysis PROXY STATEMENT
The Western Union Company – Proxy Statement | 48
NOTICE OF 2014 ANNUAL MEETING OF STOCKHOLDERS AND PROXY STATEMENT
• Increasecross-functionalexecutivefocusinthe
coming years on key performance metrics through
performance-based restricted stock unit awards; and
• Retaintheservicesofexecutivesthroughmulti-year
vesting provisions.
The 2013 performance-based restricted stock unit awards
will vest if and only to the extent that specific performance
goals for revenues and operating income are met during
the performance period. The 2013 grid provides for
a payout of 95% of target if the Company achieves
its internal operating plan for revenues and operating
income during the performance period. Because in 2013
the Company was implementing key strategic actions,
the Compensation Committee approved 2013 and 2014
financial performance metrics, while still maintaining a
longer-term perspective in the program with a TSR payout
modifier. Given the difficulty at the time of forecasting
multi-year financial results, the Compensation Committee
believed that it was appropriate to use shorter-term
financial objectives as key indicators of the Company’s
execution of its 2013 strategic plan.
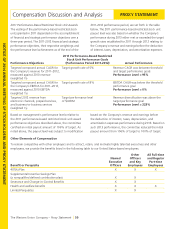
Under the terms of the performance-based restricted
stock unit awards, as much as 150% of the targeted
performance-based restricted stock unit awards may
be earned based on the Company’s performance with
respect to the two performance objectives described
above, with 50% of the award determined based on 2013
performance and the other 50% based on 2014 growth
as compared to 2013. Further, the 2013 performance-
based restricted stock unit awards include a relative TSR
performance measure that may increase or decrease
the payout of the award by up to 33% based on the
Company’s TSR performance relative to the TSR of the
S&P 500 Index over the 2013-2015 performance period.
No adjustment will be made to the award payout level if
the Company’s TSR performance is between the 40th and
60th percentile of the TSR performance of the S&P 500
Index over the 2013-2015 performance period. The 2013
performance-based restricted stock unit awards include a
maximum payout of 200% of the targeted awards based
on achieving maximum revenue and operating income
performance objectives and relative TSR performance in
the top quartile of the S&P 500 Index, as compared to the
maximum payout of 300% of the targeted performance-
based restricted stock unit awards used in prior years.
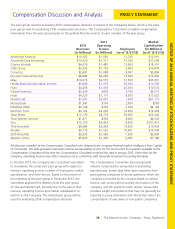
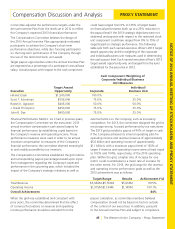
The performance objectives for payment of the 2013
performance-based restricted stock unit awards and their
respective weightings were:
• 2013revenueandoperatingincome (each weighted
50%), measured against the Company’s 2013 strategic
operating plan (weighting 50%); and
• Targetedannualconstantcurrencygrowthratefor
revenue and operating income (each weighted 50%),
comparing 2014 actual performance against 2013
actual performance (weighting 50%).
Given the focus in 2013 on revenue and operating
income performance, the committee determined that it
was appropriate to use revenue and operating income
metrics in the design of both the Annual Incentive Plan
and Long-Term Incentive Plan. Accordingly, 2013 revenue
and operating income performance was measured using
the same grid that was used for purposes of the Annual
Incentive Plan, but with an extension of the grid to a
150% payout level (based on achieving revenue and
operating income equal to or greater than approximately
$5.9 billion and $1.2 billion, respectively) rather than
the maximum cash payout level of 125% under the
Annual Incentive Plan. Please see page 45 for the 2013
revenue and operating income payout grid. Under the
Annual Incentive Plan, the committee supplemented
these performance metrics with the addition of strategic
and individual/business unit performance objectives,
while in the Long-Term Incentive Plan the metrics were
supplemented with a TSR modifier. The committee viewed
these additional performance metrics as complementary
to the revenue and operating income objectives as well
as the Company’s strategic operating plan. For 2014, the
performance-based restricted stock units will vest based
on the growth rate for revenue and operating income as
compared to 2013.
Similar to the Annual Incentive Plan, when the financial
performance objectives were established, the committee
determined that the effect of currency fluctuations on