Western Union 2013 Annual Report Download - page 57
Download and view the complete annual report
Please find page 57 of the 2013 Western Union annual report below. You can navigate through the pages in the report by either clicking on the pages listed below, or by using the keyword search tool below to find specific information within the annual report.-
 1
1 -
2
-
3
-
4
-
5
-
6
-
7
-
8
-
9
-
10
-
11
-
12
-
13
-
14
-
15
-
16
-
17
-
18
-
19
-
20
-
21
-
22
-
23
-
24
-
25
-
26
-
27
-
28
-
29
-
30
-
31
-
32
-
33
-
34
-
35
-
36
-
37
-
38
-
39
-
40
-
41
-
42
-
43
-
44
-
45
-
46
-
 47
47 -
 48
48 -
 49
49 -
 50
50 -
 51
51 -
 52
52 -
 53
53 -
 54
54 -
 55
55 -
 56
56 -
 57
57 -
 58
58 -
 59
59 -
 60
60 -
 61
61 -
 62
62 -
 63
63 -
 64
64 -
 65
65 -
 66
66 -
 67
67 -
68
-
69
-
70
-
71
-
72
-
73
-
74
-
75
-
76
-
77
-
78
-
79
-
80
-
81
-
82
-
83
-
84
-
85
-
86
-
87
-
88
-
89
-
90
-
91
-
92
-
93
-
94
-
95
-
96
-
97
-
98
-
99
-
100
-
101
-
102
-
103
-
104
-
105
-
106
-
107
-
108
-
109
-
110
-
111
-
112
-
113
-
114
-
115
-
116
-
117
-
118
-
119
-
120
-
121
-
122
-
123
-
124
-
125
-
126
-
127
-
128
-
129
-
130
-
131
-
132
-
133
-
134
-
135
-
136
-
137
-
138
-
139
-
140
-
141
-
142
-
143
-
144
-
145
-
146
-
147
-
148
-
149
-
150
-
151
-
152
-
153
-
154
-
155
-
156
-
157
-
158
-
159
-
160
-
161
-
162
-
163
-
164
-
165
-
166
-
167
-
168
-
169
-
170
-
171
-
172
-
173
-
174
-
175
-
176
-
177
-
178
-
179
-
180
-
181
-
182
-
183
-
184
-
185
-
186
-
187
-
188
-
189
-
190
-
191
-
192
-
193
-
194
-
195
-
196
-
197
-
198
-
199
-
200
-
201
-
202
-
203
-
204
-
205
-
206
-
207
-
208
-
209
-
210
-
211
-
212
-
213
-
214
-
215
-
216
-
217
-
218
-
219
-
220
-
221
-
222
-
223
-
224
-
225
-
226
-
227
-
228
-
229
-
230
-
231
-
232
-
233
-
234
-
235
-
236
-
237
-
238
-
239
-
240
-
241
-
242
-
243
-
244
-
245
-
246
-
247
-
248
-
249
-
250
-
251
-
252
-
253
-
254
-
255
-
256
-
257
-
258
-
259
-
260
-
261
-
262
-
263
-
264
-
265
-
266
-
267
-
268
-
269
-
270
-
271
-
272
-
273
-
274
 |
 |

39 | The Western Union Company – Proxy Statement
NOTICE OF 2014 ANNUAL MEETING OF STOCKHOLDERS AND PROXY STATEMENT
Compensation Discussion and Analysis PROXY STATEMENT
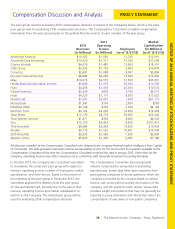
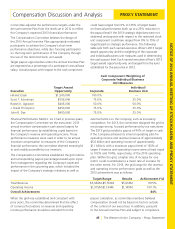
The peer group used for evaluating 2013 compensation decisions consisted of the companies below, which is the same
peer group used for evaluating 2012 compensation decisions. The Compensation Consultant compiled compensation
information from the peer group based on the publicly filed documents of each member of the peer group.
2012
Revenues
(in Millions)
2012
Operating
Income
(in Millions)
Employees
(as of 12/31/12)
Market
Capitalization
(in Millions)
(as of 12/31/12)
Ameriprise Financial $10,263 $1,585 12,235 $12,991
Automatic Data Processing $10,920 $1,977 57,000 $27,638
Charles Schwab $4,979 $1,485 13,800 $18,310
CME Group $2,953 $1,752 2,600 $16,893
Comerica $2,681 $1,088 8,967 $5,806
Discover Financial Services $8,984 $4,239 13,009 $19,459
eBay $14,072 $2,919 31,500 $65,991
Fidelity National Information Services $5,808 $1,079 35,000 $10,206
Fiserv $4,458 $1,069 20,000 $10,574
Global Payments $2,309 $409 3,796 $3,573
Intuit $4,223 $1,110 8,500 $17,622
MasterCard $7,391 $3,957 7,500 $61,171
MoneyGram $1,341 $176 2,490 $769
NASDAQ OMX $3,108 $730 2,506 $4,128
Northern Trust $4,194 $2,063 14,200 $12,028
State Street $10,125 $4,774 29,660 $22,040
Total Systems Services $1,871 $359 8,600 $4,002
Visa $10,720 $6,424 8,500 $101,414
75th Percentile $8,984 $2,063 14,200 $19,459
Median $4,719 $1,535 10,601 $14,942
25th Percentile $2,953 $1,069 7,500 $5,806
Western Union $5,665 $1,330 9,000 $7,786
All data was compiled by the Compensation Consultant who obtained peer company financial market intelligence from Capital
IQ Compustat. The data generally represents revenue and operating income for the most recent four quarters available to the
Compensation Consultant at the time the Compensation Consultant compiled the data in January 2013. Other than for the
Company, operating income may reflect measures not in conformity with Generally Accepted Accounting Principles.
In October 2013, the Compensation Consultant was asked
to re-evaluate the Company’s peer group with respect to
revenue, operating income, number of employees, market
capitalization, and other factors. Based on this review of
the members of the peer group in December 2013, the
committee approved the deletion from the peer group
of Visa and MasterCard, primarily due to the size of their
revenue, operating income and market capitalization in
relation to the Company. The revised peer group will be
used for evaluating 2014 compensation decisions.
The Compensation Committee also uses general
industry compensation survey data in evaluating
executive pay. Survey data relies upon responses from
participating companies to survey questions, which are
compiled and sorted by the surveyor based on various
factors, such as the period covered, the location of the
company, and the positions under review. Survey data
provides insight into positions that may not generally be
reported in proxy statements and information about the
compensation of executives of non-public companies.