Western Union 2013 Annual Report Download - page 58
Download and view the complete annual report
Please find page 58 of the 2013 Western Union annual report below. You can navigate through the pages in the report by either clicking on the pages listed below, or by using the keyword search tool below to find specific information within the annual report.-
 1
1 -
2
-
3
-
4
-
5
-
6
-
7
-
8
-
9
-
10
-
11
-
12
-
13
-
14
-
15
-
16
-
17
-
18
-
19
-
20
-
21
-
22
-
23
-
24
-
25
-
26
-
27
-
28
-
29
-
30
-
31
-
32
-
33
-
34
-
35
-
36
-
37
-
38
-
39
-
40
-
41
-
42
-
43
-
44
-
45
-
46
-
47
-
 48
48 -
 49
49 -
 50
50 -
 51
51 -
 52
52 -
 53
53 -
 54
54 -
 55
55 -
 56
56 -
 57
57 -
 58
58 -
 59
59 -
 60
60 -
 61
61 -
 62
62 -
 63
63 -
 64
64 -
 65
65 -
 66
66 -
 67
67 -
 68
68 -
69
-
70
-
71
-
72
-
73
-
74
-
75
-
76
-
77
-
78
-
79
-
80
-
81
-
82
-
83
-
84
-
85
-
86
-
87
-
88
-
89
-
90
-
91
-
92
-
93
-
94
-
95
-
96
-
97
-
98
-
99
-
100
-
101
-
102
-
103
-
104
-
105
-
106
-
107
-
108
-
109
-
110
-
111
-
112
-
113
-
114
-
115
-
116
-
117
-
118
-
119
-
120
-
121
-
122
-
123
-
124
-
125
-
126
-
127
-
128
-
129
-
130
-
131
-
132
-
133
-
134
-
135
-
136
-
137
-
138
-
139
-
140
-
141
-
142
-
143
-
144
-
145
-
146
-
147
-
148
-
149
-
150
-
151
-
152
-
153
-
154
-
155
-
156
-
157
-
158
-
159
-
160
-
161
-
162
-
163
-
164
-
165
-
166
-
167
-
168
-
169
-
170
-
171
-
172
-
173
-
174
-
175
-
176
-
177
-
178
-
179
-
180
-
181
-
182
-
183
-
184
-
185
-
186
-
187
-
188
-
189
-
190
-
191
-
192
-
193
-
194
-
195
-
196
-
197
-
198
-
199
-
200
-
201
-
202
-
203
-
204
-
205
-
206
-
207
-
208
-
209
-
210
-
211
-
212
-
213
-
214
-
215
-
216
-
217
-
218
-
219
-
220
-
221
-
222
-
223
-
224
-
225
-
226
-
227
-
228
-
229
-
230
-
231
-
232
-
233
-
234
-
235
-
236
-
237
-
238
-
239
-
240
-
241
-
242
-
243
-
244
-
245
-
246
-
247
-
248
-
249
-
250
-
251
-
252
-
253
-
254
-
255
-
256
-
257
-
258
-
259
-
260
-
261
-
262
-
263
-
264
-
265
-
266
-
267
-
268
-
269
-
270
-
271
-
272
-
273
-
274
 |
 |

Compensation Discussion and Analysis PROXY STATEMENT
The Western Union Company – Proxy Statement | 40
NOTICE OF 2014 ANNUAL MEETING OF STOCKHOLDERS AND PROXY STATEMENT
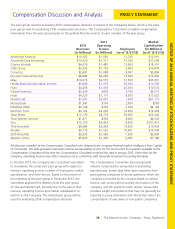
In some instances, survey data is a useful complement
to the peer group proxy data. To assist the committee
in its review of the general industry compensation
survey data, the Compensation Consultant extracts
compensation information from the surveys with respect
to companies with annual revenues ranging from $3 billion
to $10 billion. For the 2013 compensation review, the
Compensation Consultant compiled compensation
data from the following general industry compensation
surveys: 2012 U.S. Mercer Benchmark Database-Executive
(which included data from 21 companies with annual
revenues between $5 billion and $10 billion); Equilar
Top 25 (which included custom data from 14 of the
companies in the Company’s peer group described above:
Ameriprise Financial, Automatic Data Processing, Charles
Schwab, CME Group, Discover Financial Services, eBay,
Fidelity National Information Services, Global Payments,
MasterCard, MoneyGram, NASDAQ OMX, State Street,
Total Systems Services, and Visa); 2012 Hewitt Total
Compensation Measurement Database (which included
data from 50 companies with annual revenues between
$5 billion and $10 billion); and 2012 Towers Watson U.S.
Compensation Data Bank General Industry Executive
Database (which included data from 102 companies with
annual revenues between $3 billion and $6 billion).
Use of Tally Sheets
The Compensation Committee reviews tally sheets that
present comprehensive data on the total compensation
package for each of the Company’s executives. These
tally sheets include historical and current compensation
data, valuations of future equity vesting, value of option
exercises in the past five years as well as analyses for
hypothetical terminations and retirements to allow the
Compensation Committee to consider the Company’s
obligations under such circumstances. The tally sheets
provide context for the committee in determining the
elements and amounts of compensation paid.
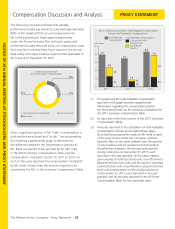
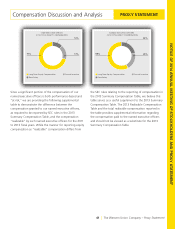
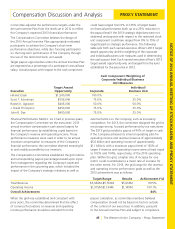
The Western Union Executive Compensation Program
Pay-For-Performance
The principal components of the 2013 executive
compensation program were annual base salary, annual
incentives in the form of cash and restricted stock unit
awards, and long-term incentive awards in the form
of stock options and performance-based restricted
stock units. The Compensation Committee designed
the 2013 executive compensation program so that
performance-based pay elements (cash and restricted
stock unit components under the Annual Incentive Plan
and stock option and performance-based restricted
stock unit components under the Long-Term Incentive
Plan) constituted a significant portion of the executive
compensation awarded, determined at target levels. The
following charts demonstrate that these variable pay
elements comprised approximately 88% of the targeted
annual compensation for the Chief Executive Officer and,
on average, 78% of the targeted annual compensation for
the other named executive officers. For purposes of these
charts, the percentage of targeted annual compensation
was determined based on the annual base salary and
target incentive opportunities applicable to the named
executive officer as of December 31, 2013.