Western Union 2013 Annual Report Download - page 253
Download and view the complete annual report
Please find page 253 of the 2013 Western Union annual report below. You can navigate through the pages in the report by either clicking on the pages listed below, or by using the keyword search tool below to find specific information within the annual report.-
 1
1 -
2
-
3
-
4
-
5
-
6
-
7
-
8
-
9
-
10
-
11
-
12
-
13
-
14
-
15
-
16
-
17
-
18
-
19
-
20
-
21
-
22
-
23
-
24
-
25
-
26
-
27
-
28
-
29
-
30
-
31
-
32
-
33
-
34
-
35
-
36
-
37
-
38
-
39
-
40
-
41
-
42
-
43
-
44
-
45
-
46
-
47
-
48
-
49
-
50
-
51
-
52
-
53
-
54
-
55
-
56
-
57
-
58
-
59
-
60
-
61
-
62
-
63
-
64
-
65
-
66
-
67
-
68
-
69
-
70
-
71
-
72
-
73
-
74
-
75
-
76
-
77
-
78
-
79
-
80
-
81
-
82
-
83
-
84
-
85
-
86
-
87
-
88
-
89
-
90
-
91
-
92
-
93
-
94
-
95
-
96
-
97
-
98
-
99
-
100
-
101
-
102
-
103
-
104
-
105
-
106
-
107
-
108
-
109
-
110
-
111
-
112
-
113
-
114
-
115
-
116
-
117
-
118
-
119
-
120
-
121
-
122
-
123
-
124
-
125
-
126
-
127
-
128
-
129
-
130
-
131
-
132
-
133
-
134
-
135
-
136
-
137
-
138
-
139
-
140
-
141
-
142
-
143
-
144
-
145
-
146
-
147
-
148
-
149
-
150
-
151
-
152
-
153
-
154
-
155
-
156
-
157
-
158
-
159
-
160
-
161
-
162
-
163
-
164
-
165
-
166
-
167
-
168
-
169
-
170
-
171
-
172
-
173
-
174
-
175
-
176
-
177
-
178
-
179
-
180
-
181
-
182
-
183
-
184
-
185
-
186
-
187
-
188
-
189
-
190
-
191
-
192
-
193
-
194
-
195
-
196
-
197
-
198
-
199
-
200
-
201
-
202
-
203
-
204
-
205
-
206
-
207
-
208
-
209
-
210
-
211
-
212
-
213
-
214
-
215
-
216
-
217
-
218
-
219
-
220
-
221
-
222
-
223
-
224
-
225
-
226
-
227
-
228
-
229
-
230
-
231
-
232
-
233
-
234
-
235
-
236
-
237
-
238
-
239
-
240
-
241
-
242
-
 243
243 -
 244
244 -
 245
245 -
 246
246 -
 247
247 -
 248
248 -
 249
249 -
 250
250 -
 251
251 -
 252
252 -
 253
253 -
 254
254 -
 255
255 -
 256
256 -
 257
257 -
 258
258 -
 259
259 -
 260
260 -
 261
261 -
 262
262 -
 263
263 -
264
-
265
-
266
-
267
-
268
-
269
-
270
-
271
-
272
-
273
-
274
 |
 |

2013 FORM 10-K
•
•
•
•
•
THE WESTERN UNION COMPANY
NOTES TO CONSOLIDATED FINANCIAL STATEMENTS (Continued)
143
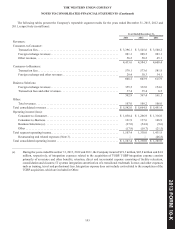
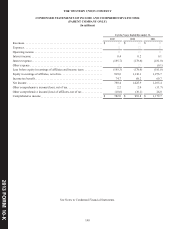
The following tables present the Company's reportable segment results for the years ended December 31, 2013, 2012 and
2011, respectively (in millions):
Year Ended December 31,
2013 2012 2011
Revenues:
Consumer-to-Consumer:
Transaction fees. . . . . . . . . . . . . . . . . . . . . . . . . . . . . . . . . . . . . . . . . . . . . . . . . . . . . . . $ 3,396.1 $ 3,545.6 $ 3,580.2
Foreign exchange revenues . . . . . . . . . . . . . . . . . . . . . . . . . . . . . . . . . . . . . . . . . . . . . . 981.3 988.5 983.1
Other revenues. . . . . . . . . . . . . . . . . . . . . . . . . . . . . . . . . . . . . . . . . . . . . . . . . . . . . . . . 56.2 50.2 45.1
4,433.6 4,584.3 4,608.4
Consumer-to-Business:
Transaction fees. . . . . . . . . . . . . . . . . . . . . . . . . . . . . . . . . . . . . . . . . . . . . . . . . . . . . . . 579.1 573.6 581.8
Foreign exchange and other revenues . . . . . . . . . . . . . . . . . . . . . . . . . . . . . . . . . . . . . . 29.4 30.3 34.1
608.5 603.9 615.9
Business Solutions:
Foreign exchange revenues . . . . . . . . . . . . . . . . . . . . . . . . . . . . . . . . . . . . . . . . . . . . . . 355.5 332.0 154.6
Transaction fees and other revenues . . . . . . . . . . . . . . . . . . . . . . . . . . . . . . . . . . . . . . . 37.4 35.4 6.5
392.9 367.4 161.1
Other:
Total revenues . . . . . . . . . . . . . . . . . . . . . . . . . . . . . . . . . . . . . . . . . . . . . . . . . . . . . . . . 107.0 109.2 106.0
Total consolidated revenues . . . . . . . . . . . . . . . . . . . . . . . . . . . . . . . . . . . . . . . . . . . . . . . . . $ 5,542.0 $ 5,664.8 $ 5,491.4
Operating income/(loss):
Consumer-to-Consumer. . . . . . . . . . . . . . . . . . . . . . . . . . . . . . . . . . . . . . . . . . . . . . . . . $ 1,030.4 $ 1,266.9 $ 1,316.0
Consumer-to-Business. . . . . . . . . . . . . . . . . . . . . . . . . . . . . . . . . . . . . . . . . . . . . . . . . . 121.9 137.6 146.9
Business Solutions (a) . . . . . . . . . . . . . . . . . . . . . . . . . . . . . . . . . . . . . . . . . . . . . . . . . . (27.0)(54.8)(9.6)
Other . . . . . . . . . . . . . . . . . . . . . . . . . . . . . . . . . . . . . . . . . . . . . . . . . . . . . . . . . . . . . . . (17.9)(19.7)(21.5)
Total segment operating income. . . . . . . . . . . . . . . . . . . . . . . . . . . . . . . . . . . . . . . . . . . . . . 1,107.4 1,330.0 1,431.8
Restructuring and related expenses (Note 3). . . . . . . . . . . . . . . . . . . . . . . . . . . . . . . . . — — (46.8)
Total consolidated operating income . . . . . . . . . . . . . . . . . . . . . . . . . . . . . . . . . . . . . . . . . . $ 1,107.4 $ 1,330.0 $ 1,385.0
____________________
(a) During the years ended December 31, 2013, 2012 and 2011, the Company incurred $19.3 million, $42.8 million and $4.8
million, respectively, of integration expenses related to the acquisition of TGBP. TGBP integration expense consists
primarily of severance and other benefits, retention, direct and incremental expense consisting of facility relocation,
consolidation and closures; IT systems integration; amortization of a transitional trademark license; and other expenses
such as training, travel and professional fees. Integration expense does not include costs related to the completion of the
TGBP acquisition, which are included in Other.